
A practical guide to building forensic timelines
This write-up shows how to build timelines from Windows machines to be examined in Triage following a compromise, from the acquisition of all artifacts to the generation of a Super-Timeline and its visualisation with Timesketch using tools such as Hayabusa, Velociraptor and plaso.
To be precise, we will carry out two distinct procedures:
- Manual acquisition with Hayabusa
- Acquisition and timeline generation with Hayabusa
- Import and display on Timesketch
- Automatic acquisition with Velociraptor
- Acquisition with KAPE Files module → SANS Triage
- Super-Timeline generation with plaso (via timesketch worker)
- Import and display on Timesketch
Lab Environment
The LAB environment used for this test consists of:
- 1 Domain Controller – Windows Server 2025
- Velociraptor Client
- 1 Workstation – Windows 11 Pro
- Hayabusa
- Velociraptor Client
- 1 Kali
- Cobalt Strike
- 1 Ubuntu 24.04 – CPU 1x4 – RAM 8GB – Disk 50GB
- Velociraptor Server
- Docker deployment
- Timesketch
- Docker deployment
- Velociraptor Server
The steps for installing the virtual machines and configuring Kali are skipped.
CobaltStrike and Harriet were used to seed IOCs in the environment, but any method can be used for this purpose.
Audit policies on the Domain Controller were not configured, as the focus is on the timeline creation procedure and its automation, working on a single server.
We will start with the first timeline: using Hayabusa to generate a timeline and then import it into Timesketch.
To do this, we move to the Ubuntu machine and proceed to install Timesketch via Docker.
Install Docker on Ubuntu
#!/bin/bash

# Remove old packages
for pkg in docker.io docker-doc docker-compose docker-compose-v2 podman-docker containerd runc; do sudo apt-get remove $pkg; done

# Add Docker's official GPG key:
sudo apt-get update
sudo apt-get install ca-certificates curl
sudo install -m 0755 -d /etc/apt/keyrings
sudo curl -fsSL https://download.docker.com/linux/ubuntu/gpg -o /etc/apt/keyrings/docker.asc
sudo chmod a+r /etc/apt/keyrings/docker.asc

# Add the repository to Apt sources:
echo \
  "deb [arch=$(dpkg --print-architecture) signed-by=/etc/apt/keyrings/docker.asc] https://download.docker.com/linux/ubuntu \
  $(. /etc/os-release && echo "${UBUNTU_CODENAME:-$VERSION_CODENAME}") stable" | \
  sudo tee /etc/apt/sources.list.d/docker.list > /dev/null

sudo apt-get update

# Install latest version
sudo apt-get install docker-ce docker-ce-cli containerd.io docker-buildx-plugin docker-compose-plugin

# Test Docker
sudo docker -v
Install Timesketch via Docker:
# install-timesketch.sh
curl -s -O https://raw.githubusercontent.com/google/timesketch/master/contrib/deploy_timesketch.sh
chmod 755 deploy_timesketch.sh
cd /opt
sudo ~/deploy_timesketch.sh
cd timesketch
sudo docker compose up -d

# Create a user named user. Set the password here.
sudo docker compose exec timesketch-web tsctl create-user user
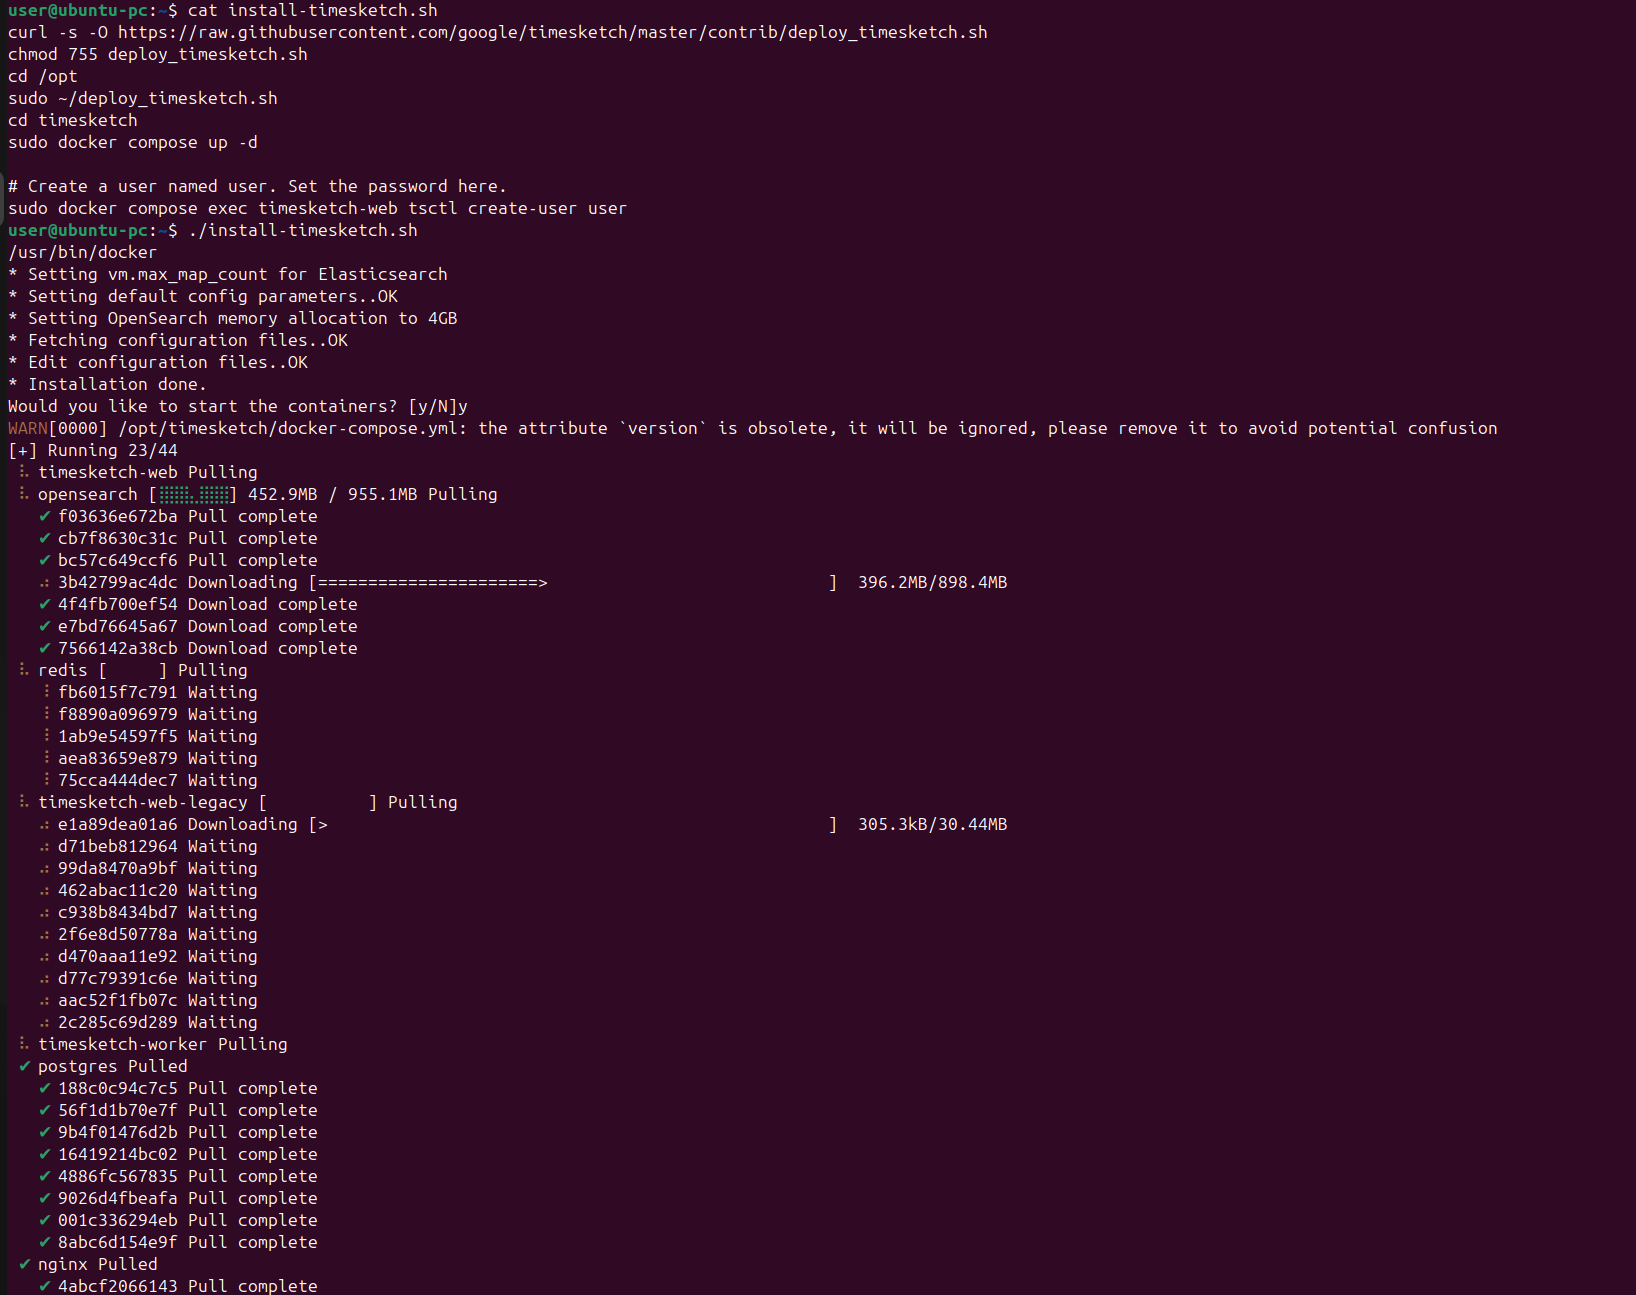
The script already includes the command to create a user, and consequently, after the Docker containers start, you will be prompted to set a password for the user account (in this case). You may use any username you prefer. For convenience, we will use user::user.

Here I repeated the operation manually. Obviously, the command shown here must be executed from the folder containing the Docker environment variables, in my case from /opt/timesketch, which is the path where the script will install everything needed to start the docker-compose.yaml of timeskecth.
Now let’s check that everything is up and running:

If you want to learn more about all the various components of TimeSketch, you can consult the documentation on their website and take a closer look at docker-compose.yaml.
One of the components is an nginx server that acts as a proxy and exposes ports 80 and 443. We will not look at how to configure the https protocol, but it is obviously possible to do so by passing the certificates within the configuration.
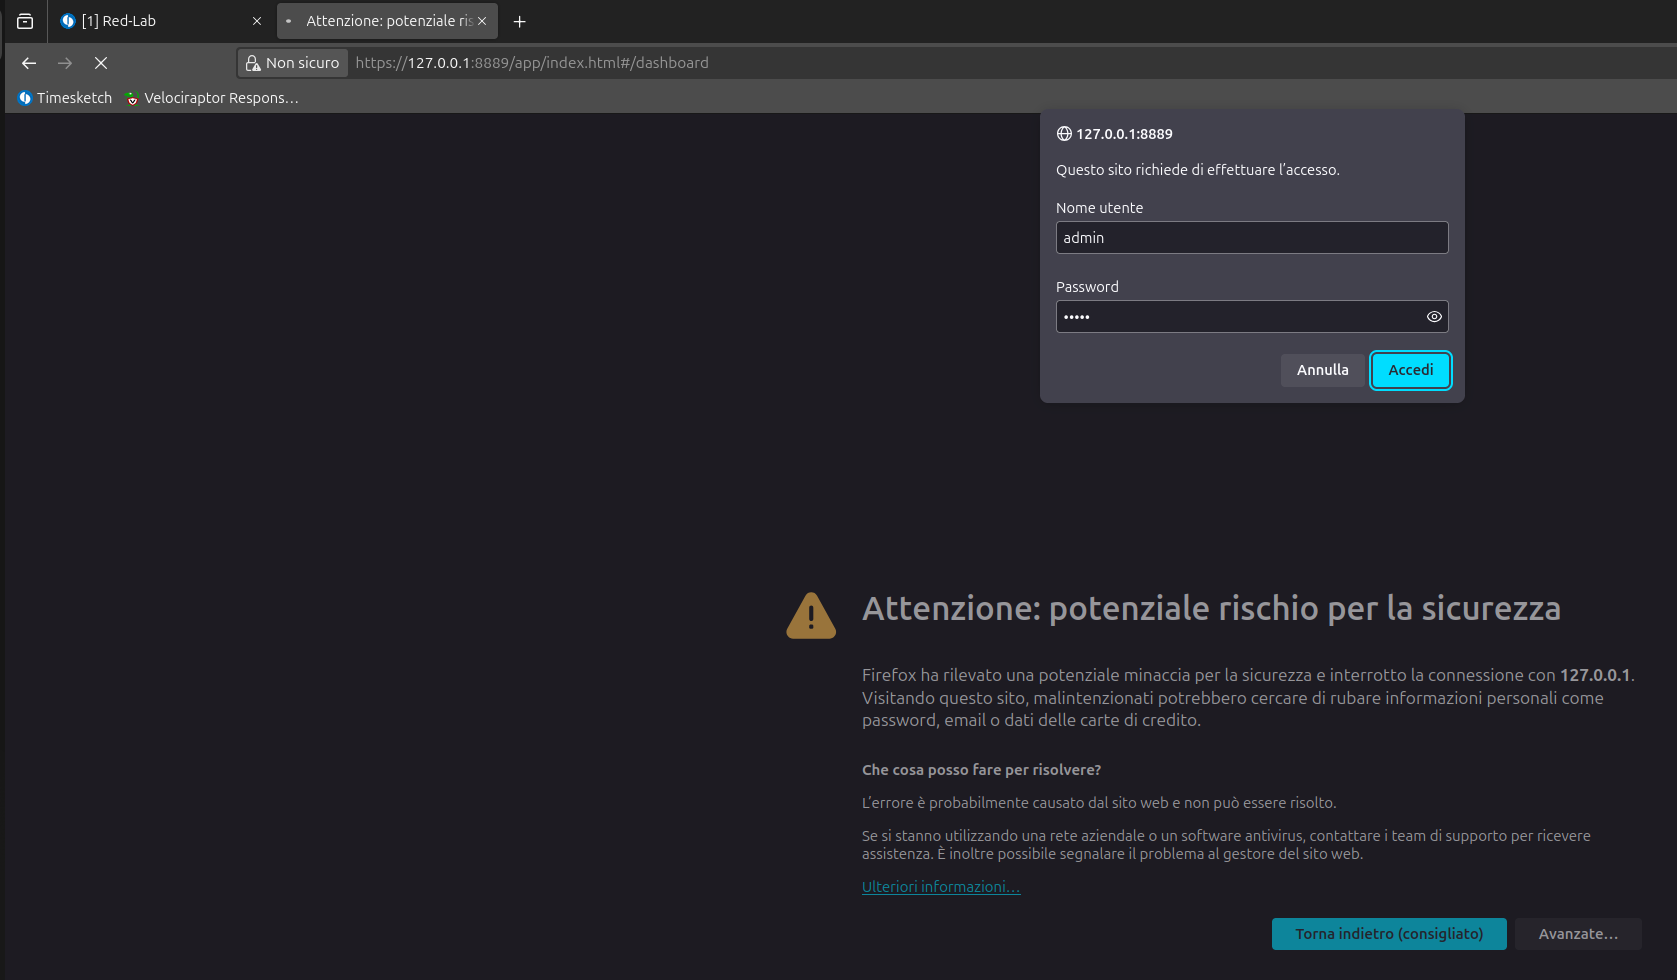
Let’s now try to log in with our browser on our localhost:
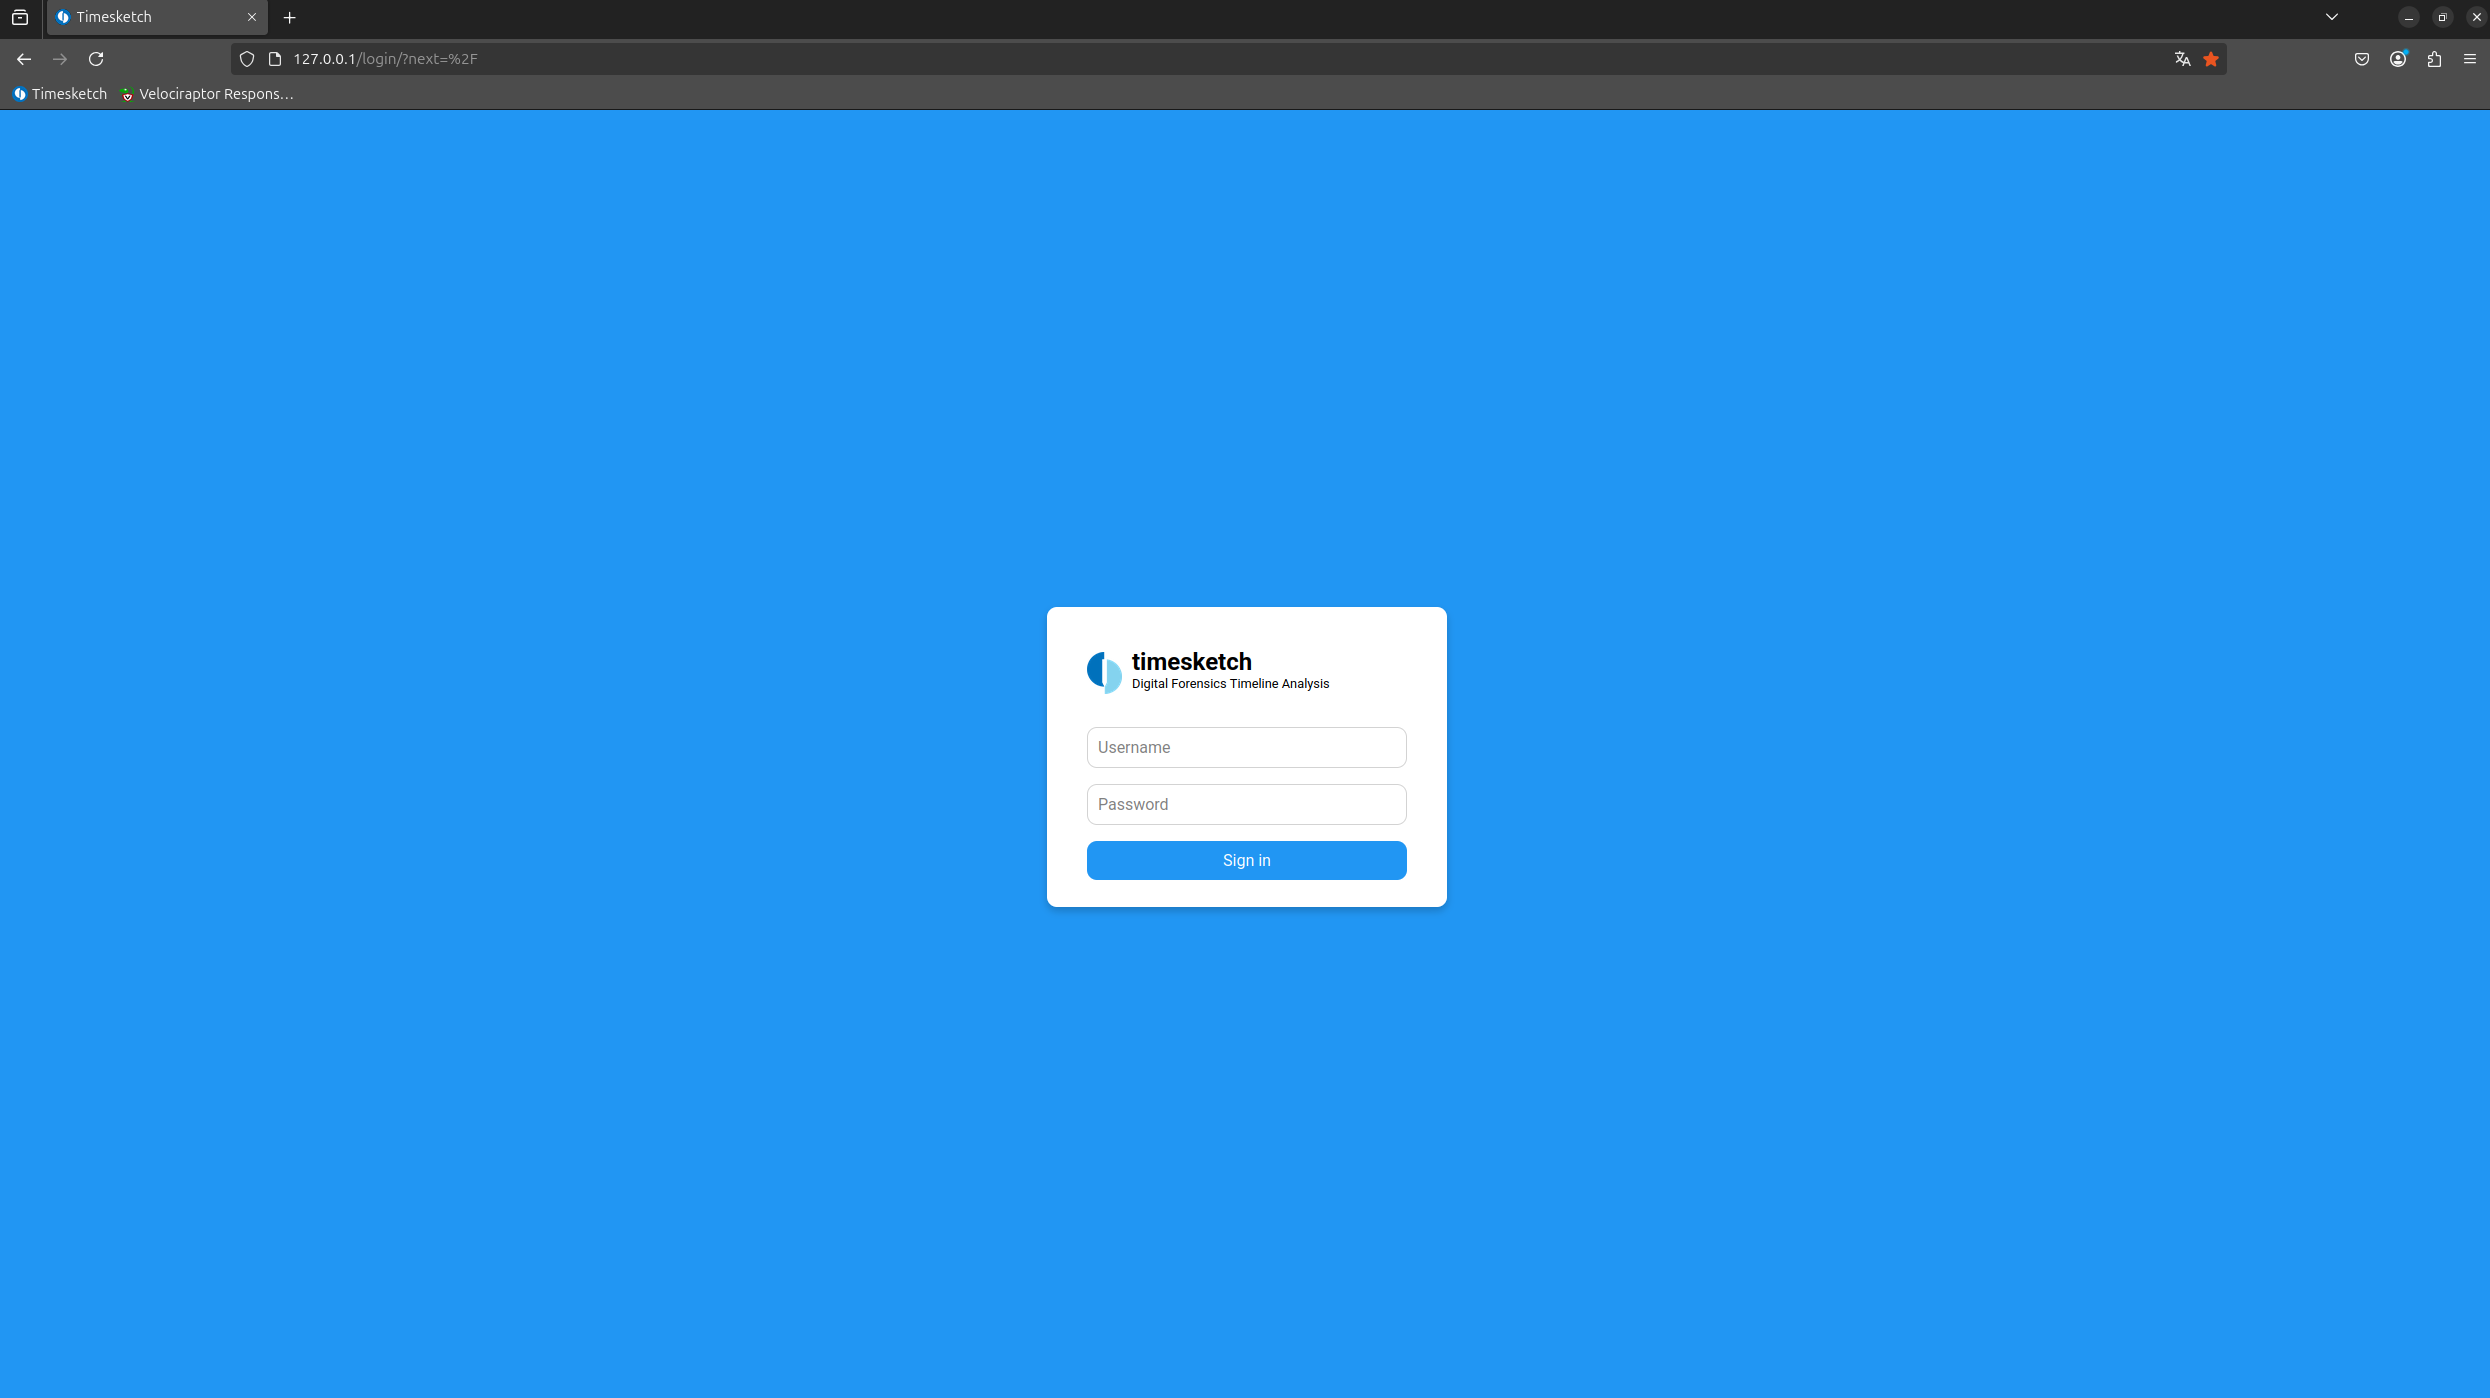
Using the credentials of the user created earlier, we are now inside our Dashboard:
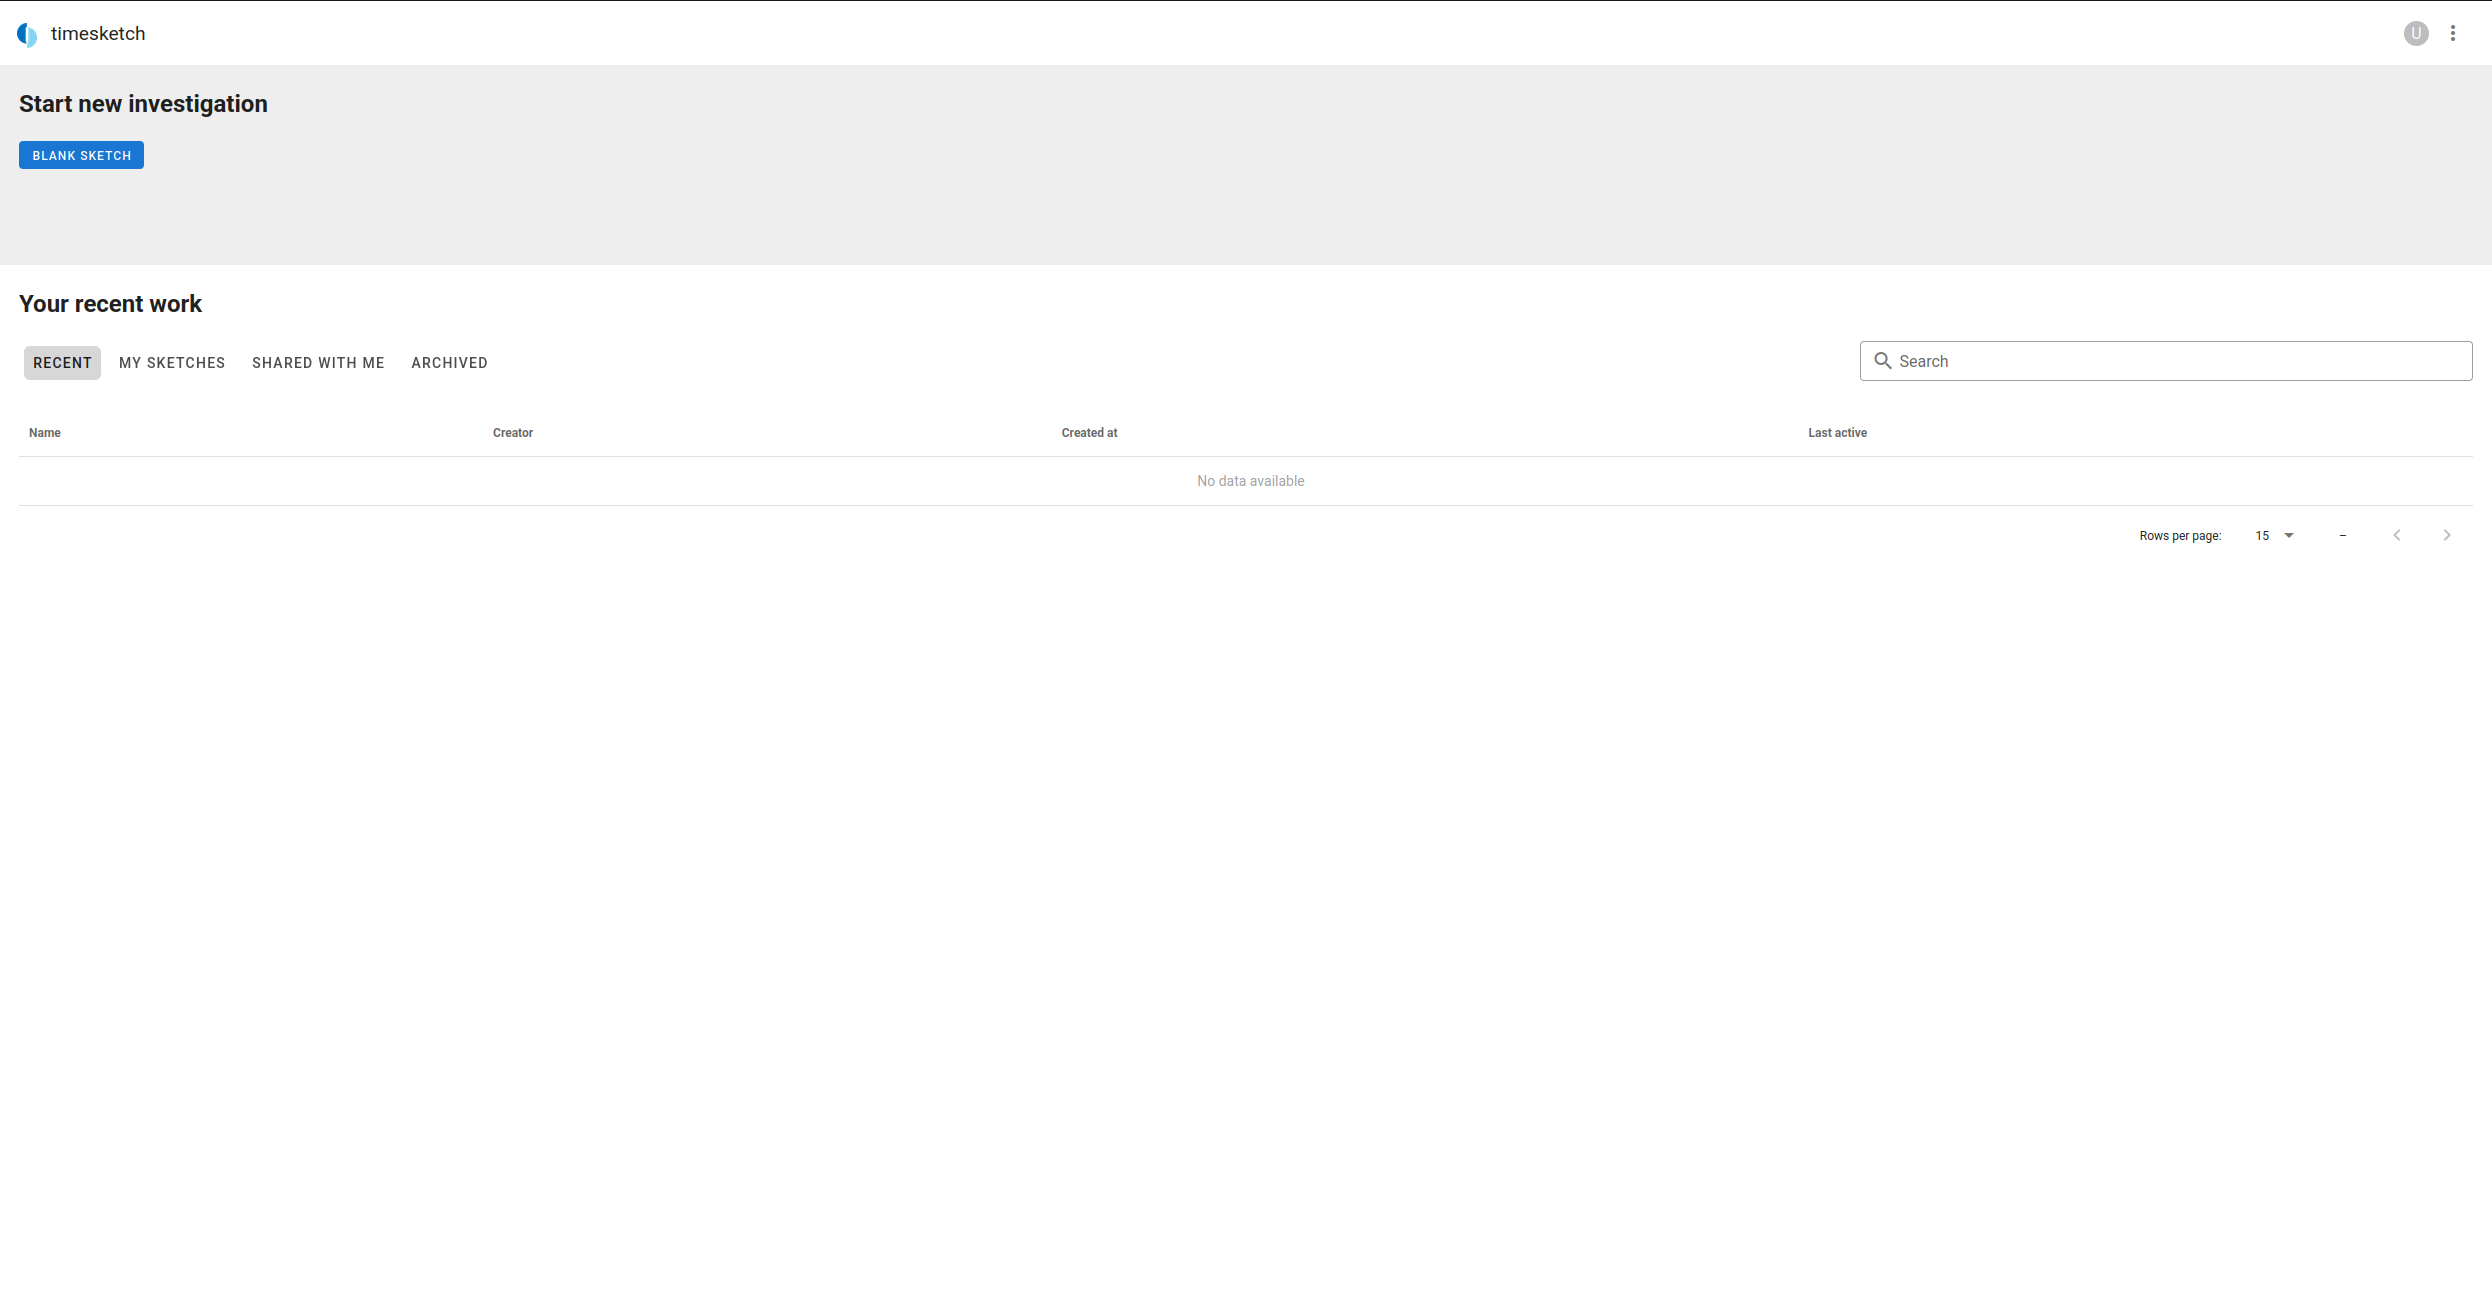
I prefer to use the dark theme to rest my eyes!
As we can see, we are inside our User account, but multiple users can collaborate within the platform, as we will see later.
1 - Manual acquisition with Hayabusa
At this point, we move to the first Windows workstation to generate our first timeline using Hayabusa.
Download Hayabusa onto the client machine, either directly from the website or by transferring it via an authorized USB drive to the target machine.
In this test scenario, I will download it directly from the Internet.
# Administrator Powershell
wget https://github.com/Yamato-Security/hayabusa/releases/download/v3.3.0/hayabusa-3.3.0-win-x64.zip -o hayabusa.zip
Expand-Archive .\hayabusa.zip .\hayabusa
cd .\hayabusa
Now, following Hayabusa’s official documentation, which shows us exactly how to create the timeline and then analyse it on Timesketch.
The arguments to pass to Hayabusa with option -d are the folder containing the logs of a previous acquisition (e.g. with KAPE) or a live analysis by passing the option -l.
Here is the command to create the timeline:
# Administrator Powershell
.\hayabusa-3.3.0-win-x64.exe csv-timeline --help
# live-analysis
.\hayabusa-3.3.0-win-x64.exe update-rules
.\hayabusa-3.3.0-win-x64.exe csv-timeline -l -o ws01-hayabusa-timeline.csv -p timesketch-verbose --ISO-8601
✏️ Note
It is necessary to choose a timesketch profile and specify the timestamp as
--ISO-8601for UTC or--RFC-3339for local time. You may add other Hayabusa options if you desire, however, do not add the-M,--multilineoption as the newline characters will corrupt the import.
💡 Tip
If your CSV file is too big to upload, you can split the file into multiple CSV files with Takajo’s
split-csv-timelinecommand.

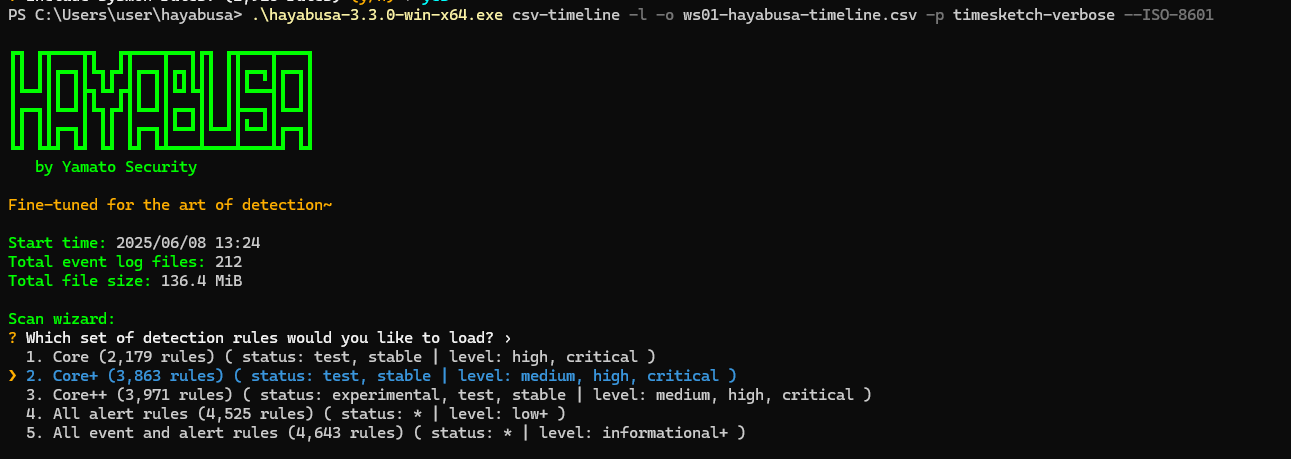
I am using the Core+ ruleset.
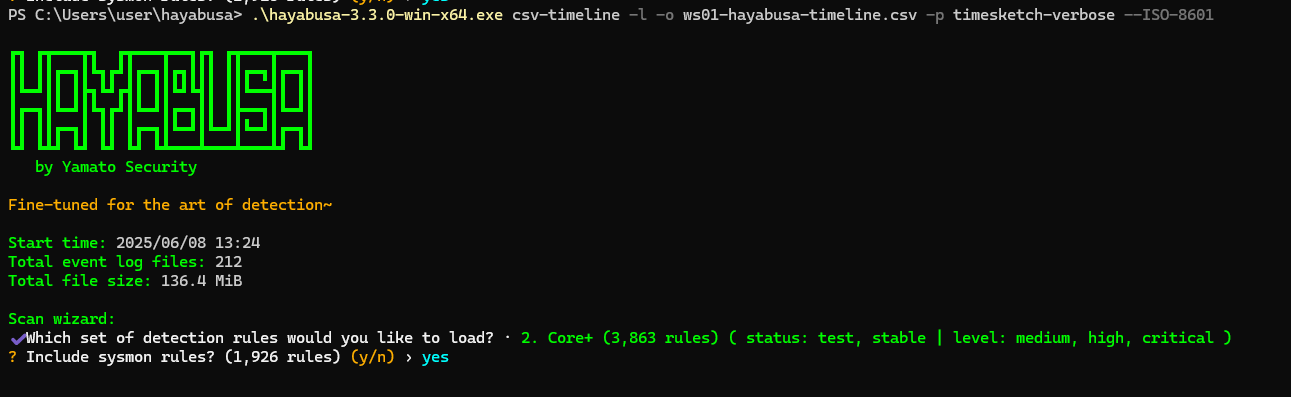
I am including the Sysmon rules.
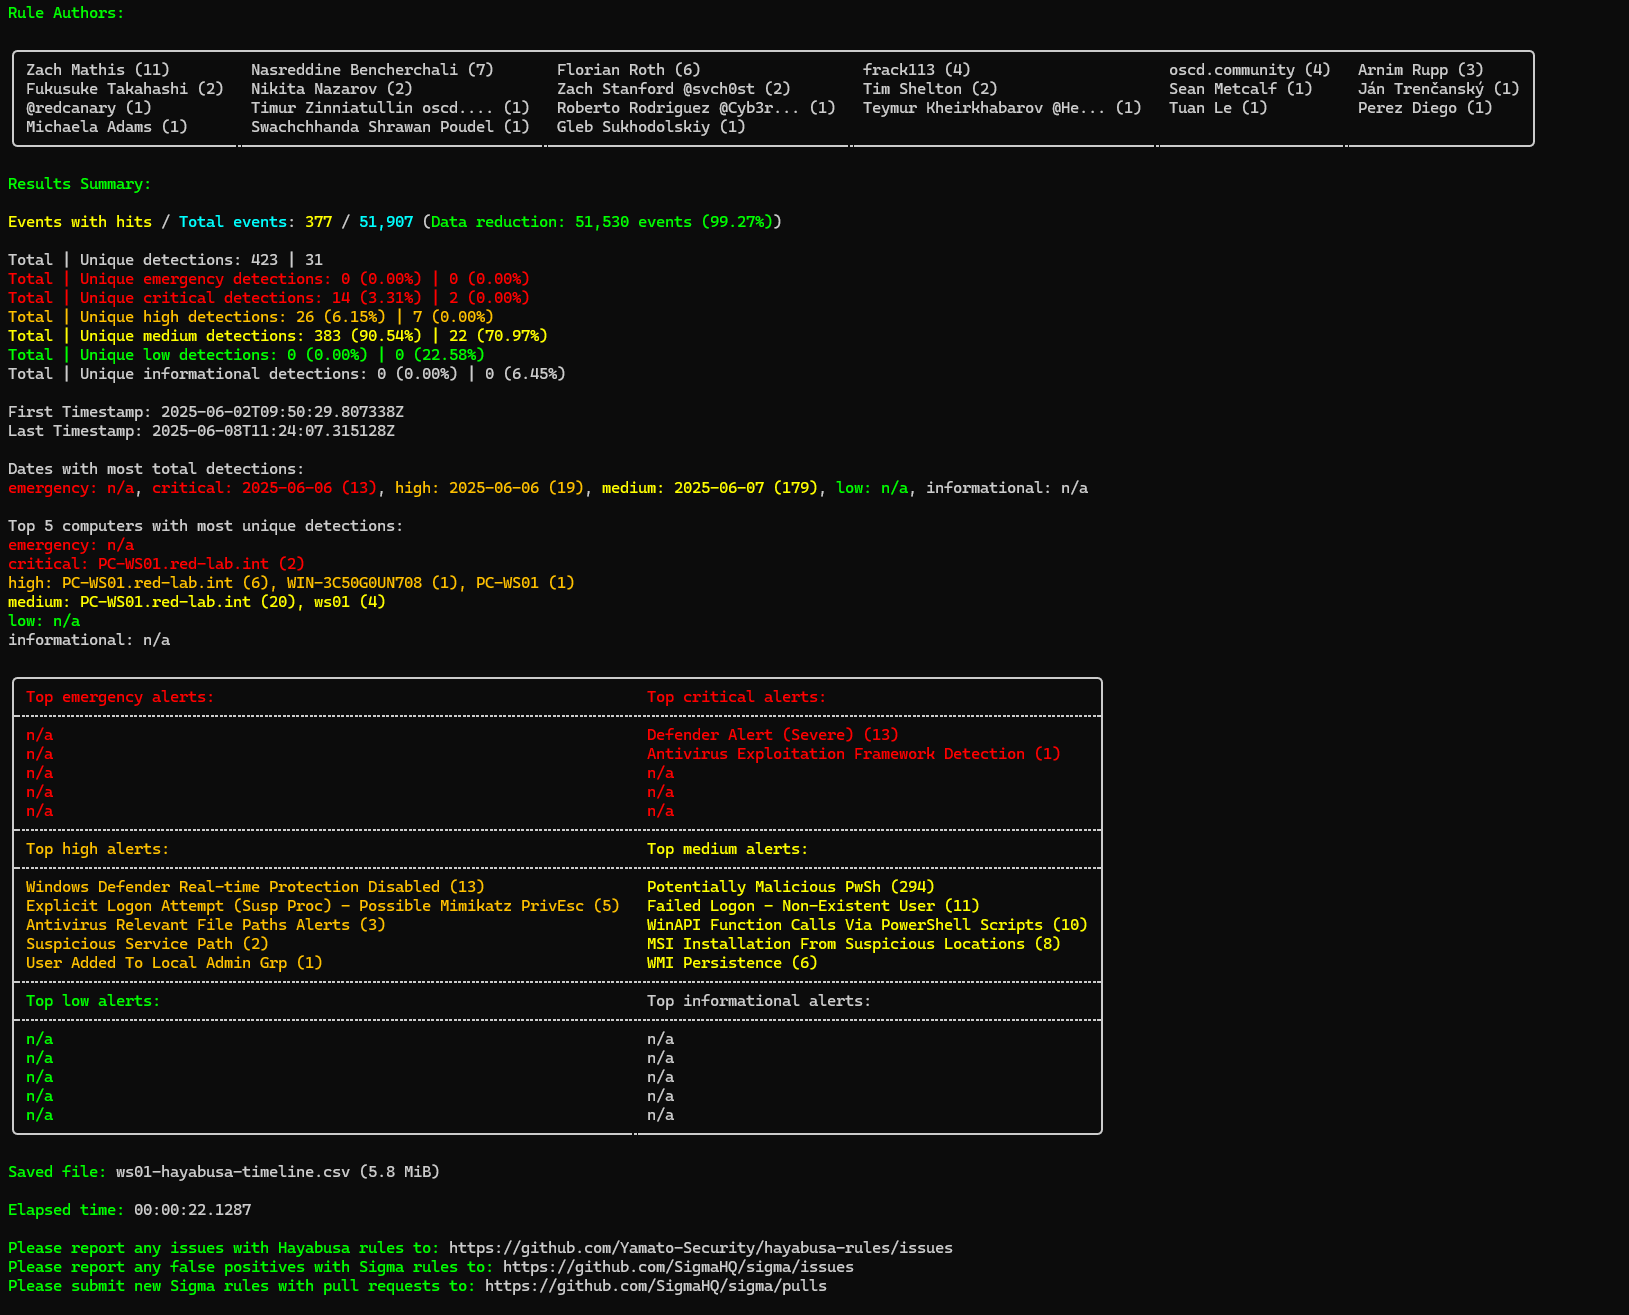
And here are the results: Hayabusa successfully generated a detailed timeline of events, which can now be imported and analyzed within Timesketch.
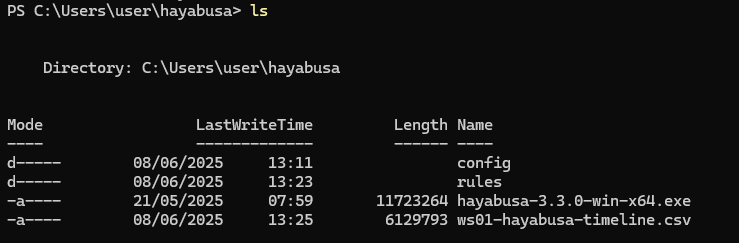
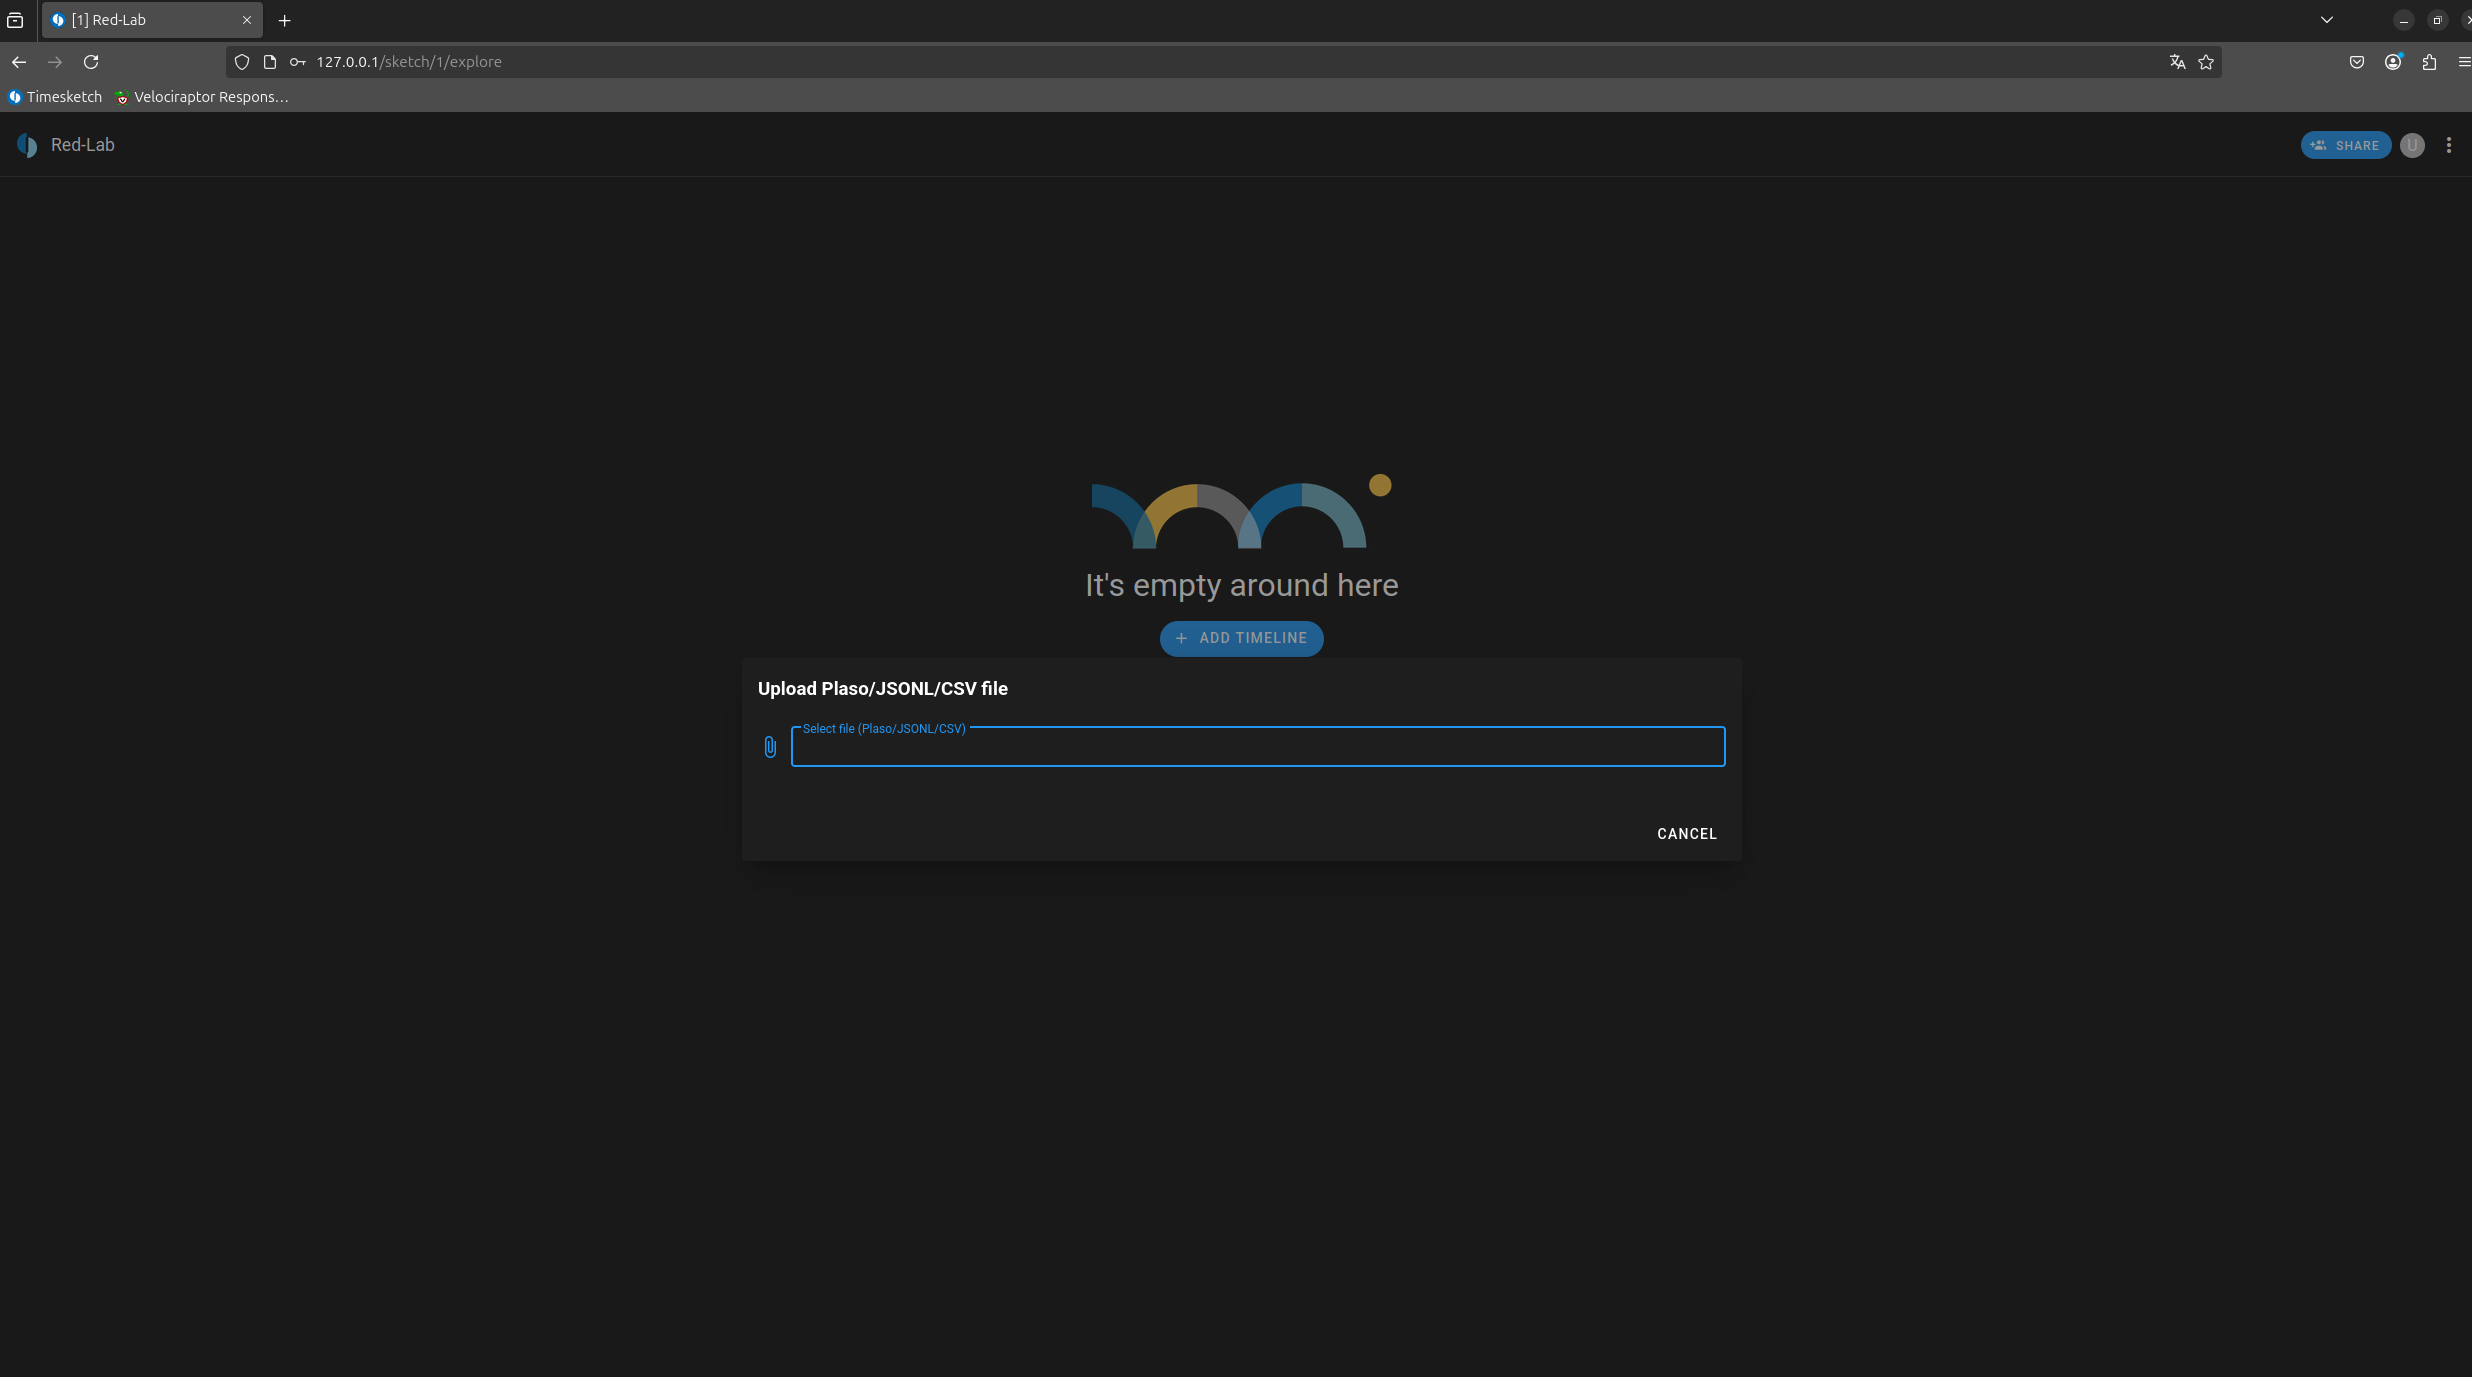
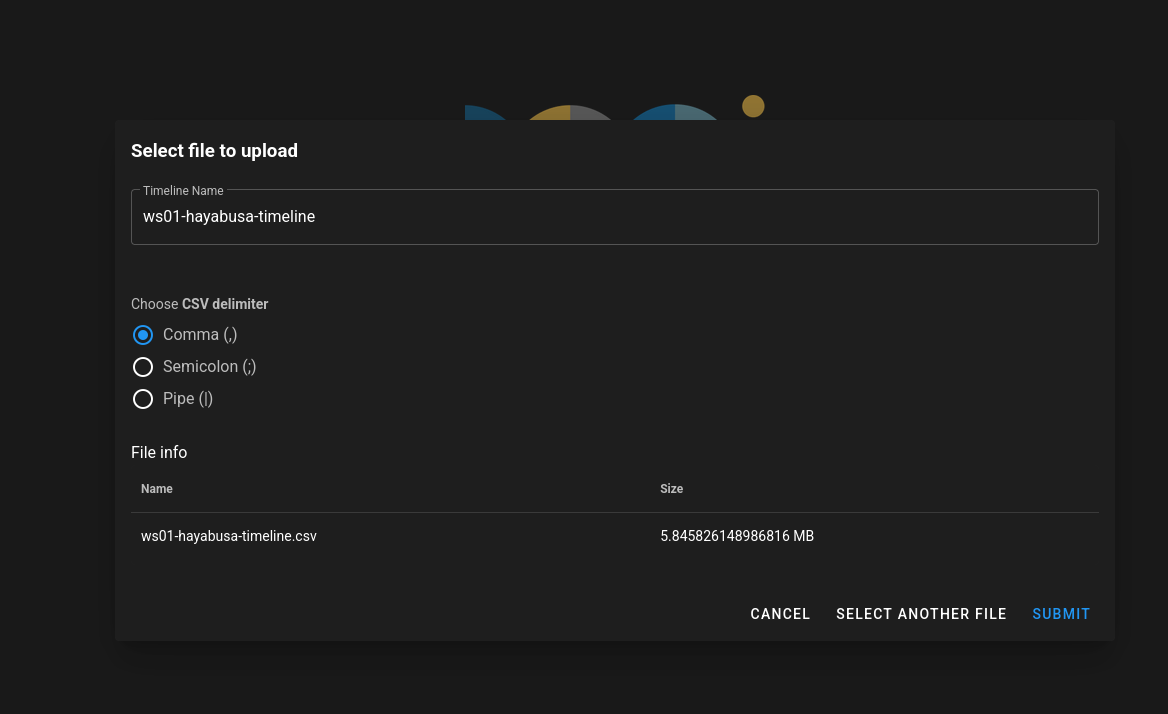
We are now ready to import our file into Timesketch.
Let’s return to the Timesketch interface and create a new investigation:
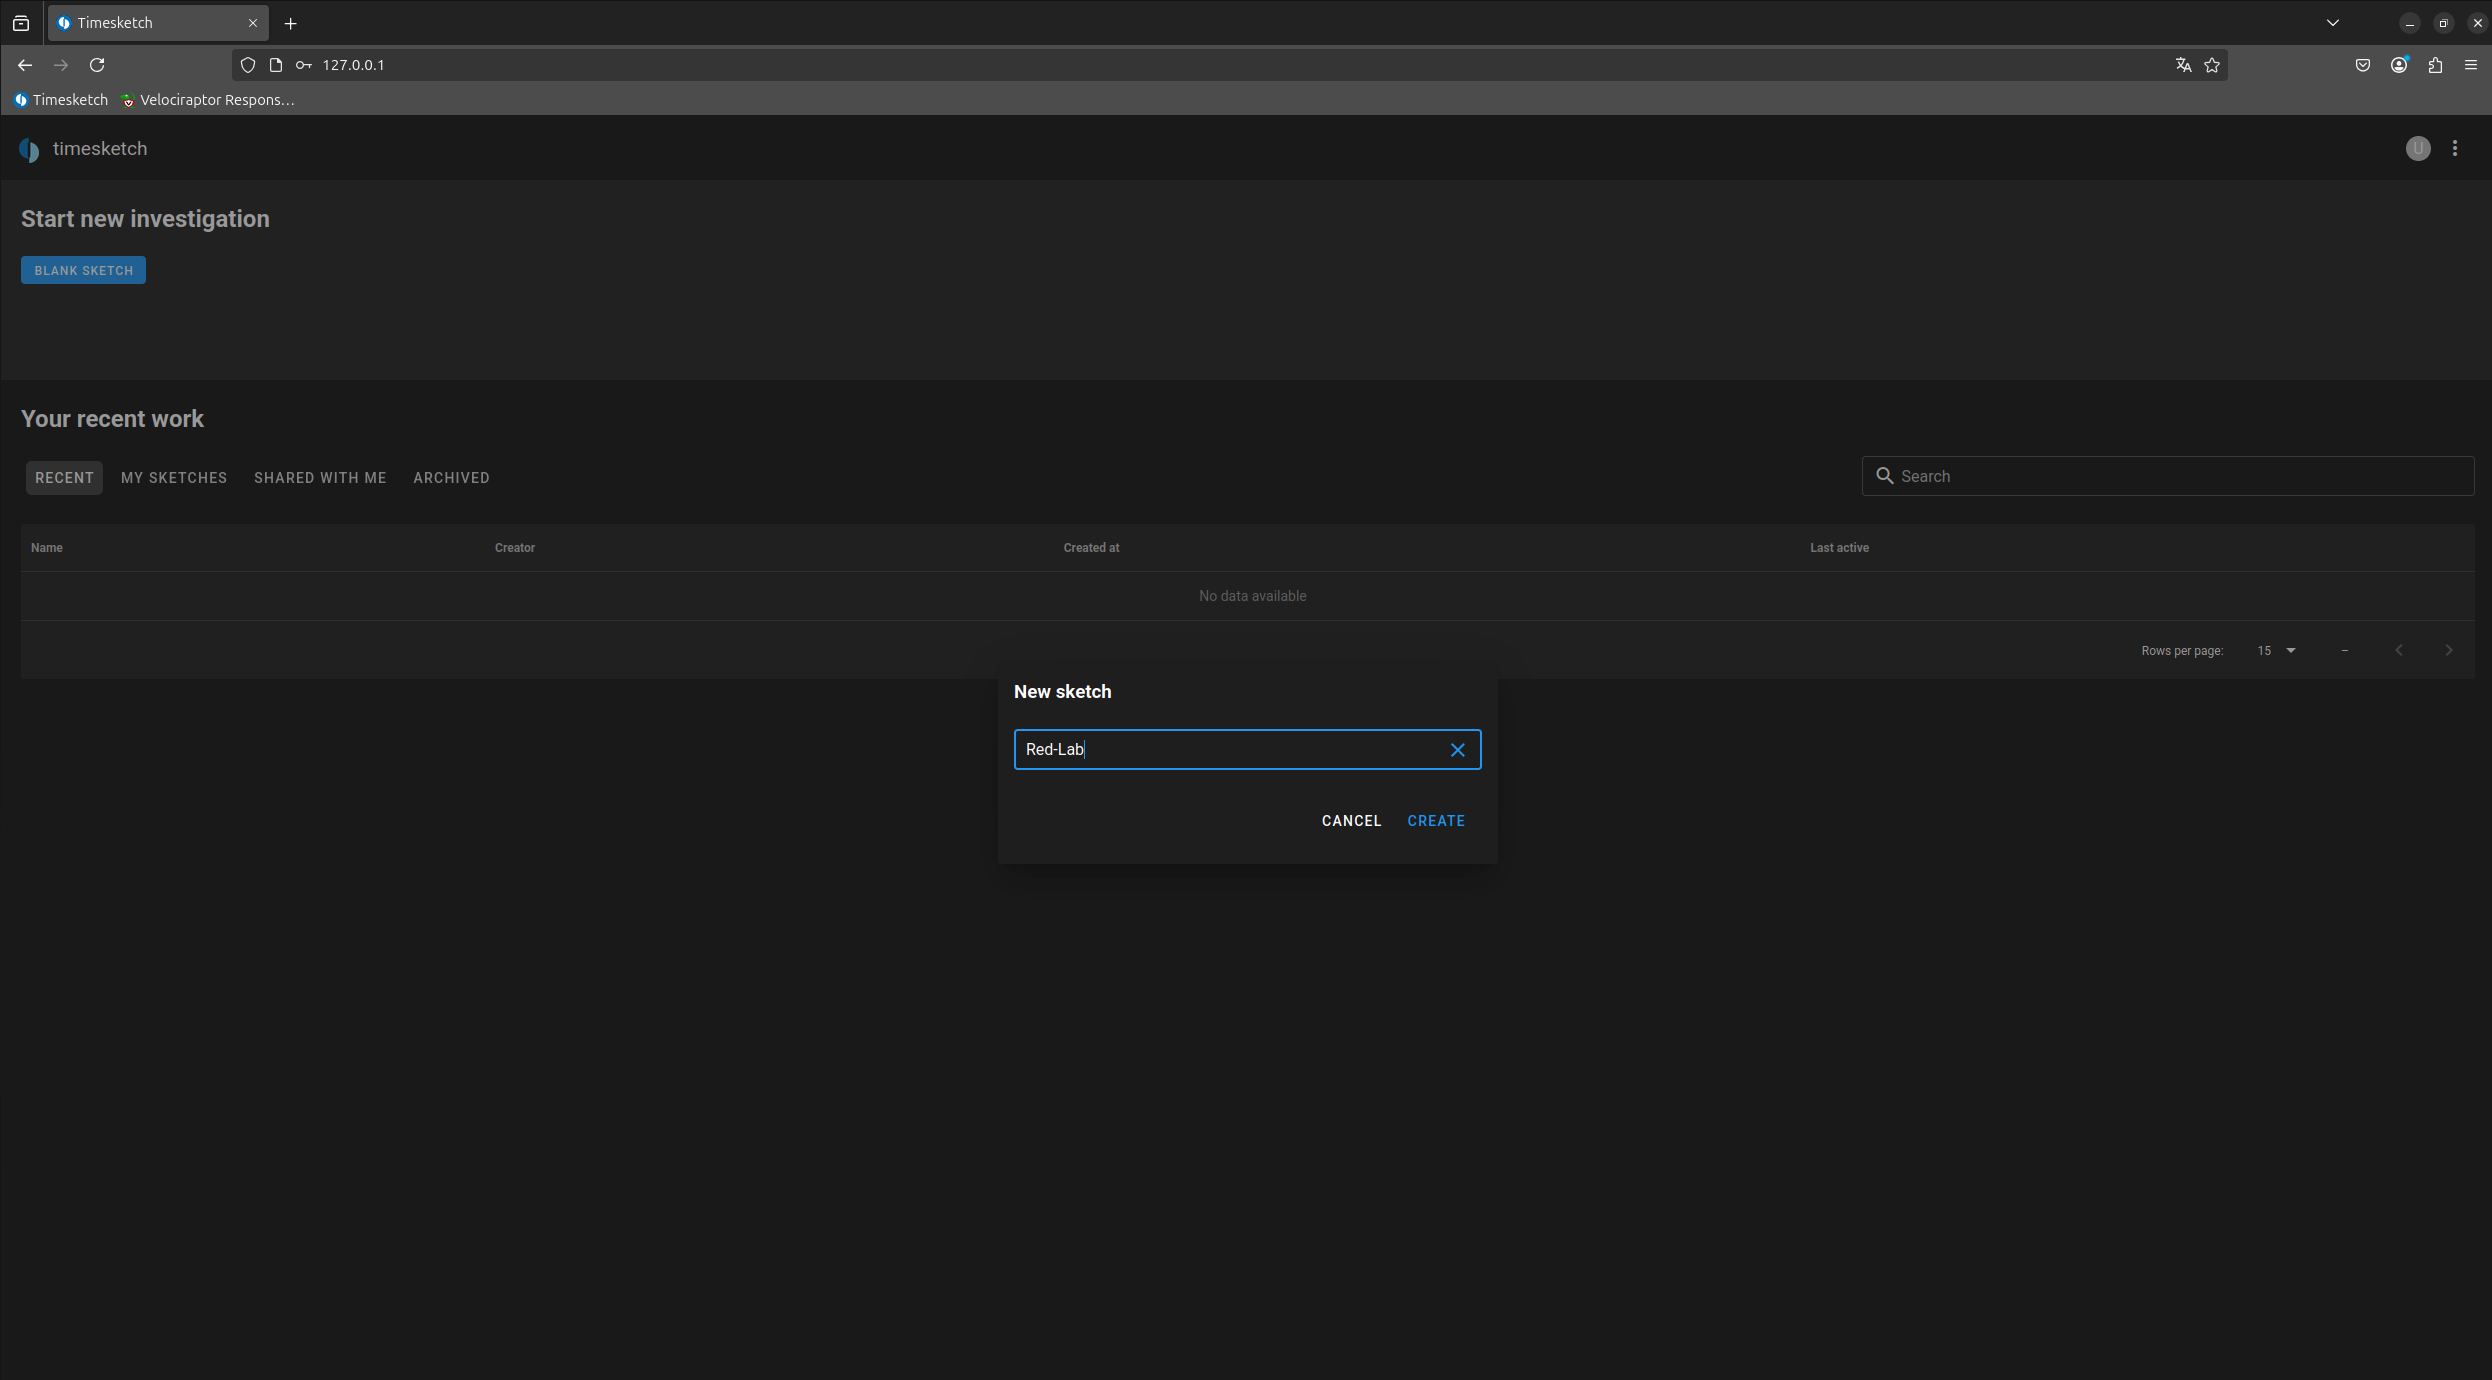
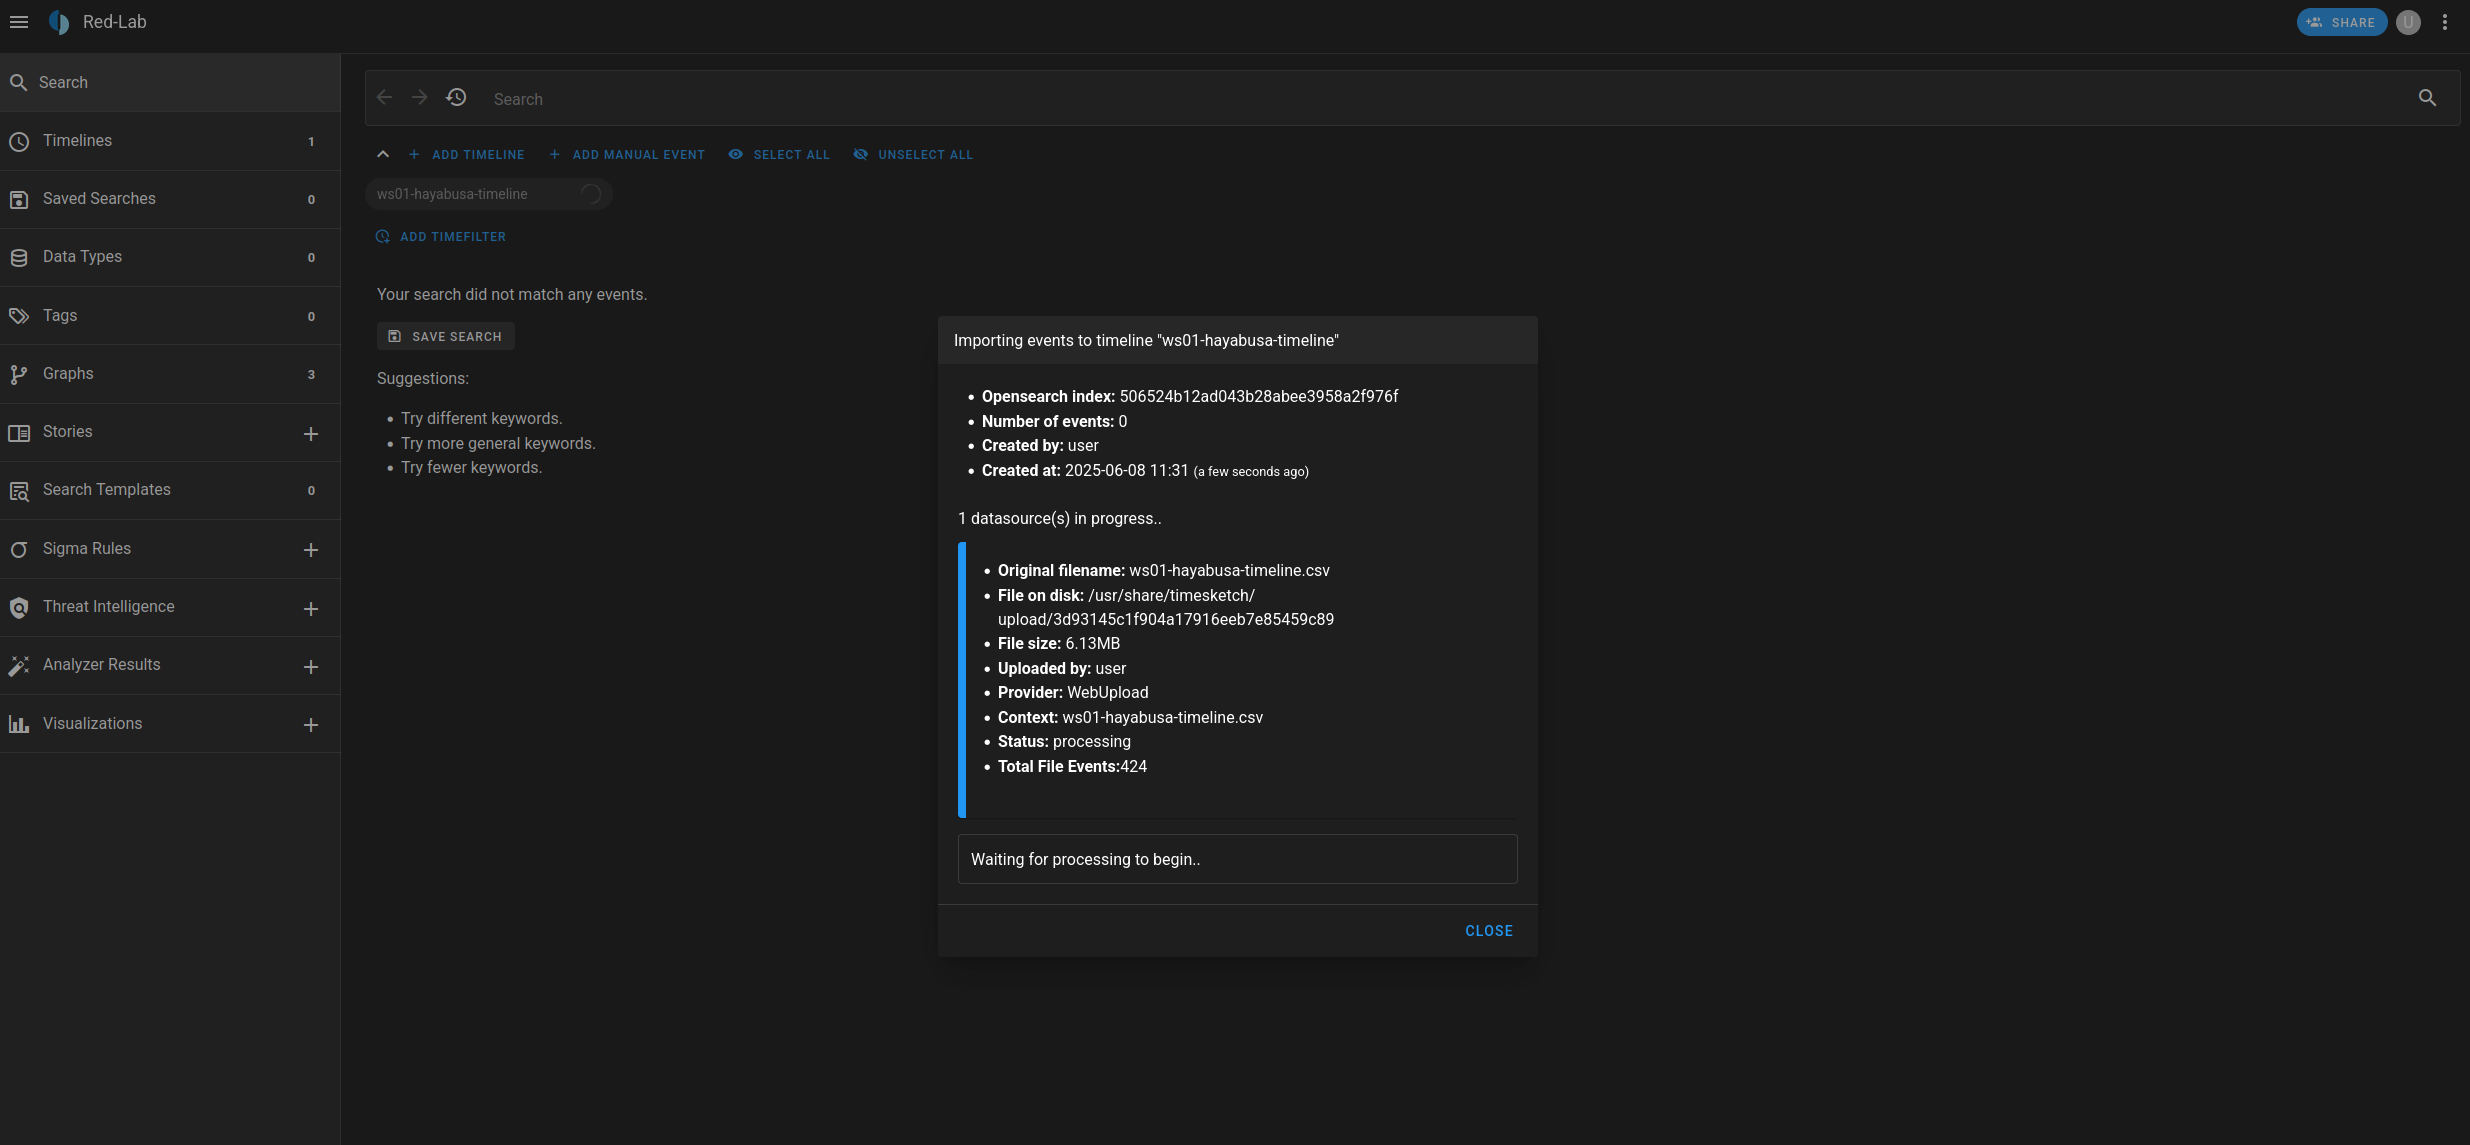
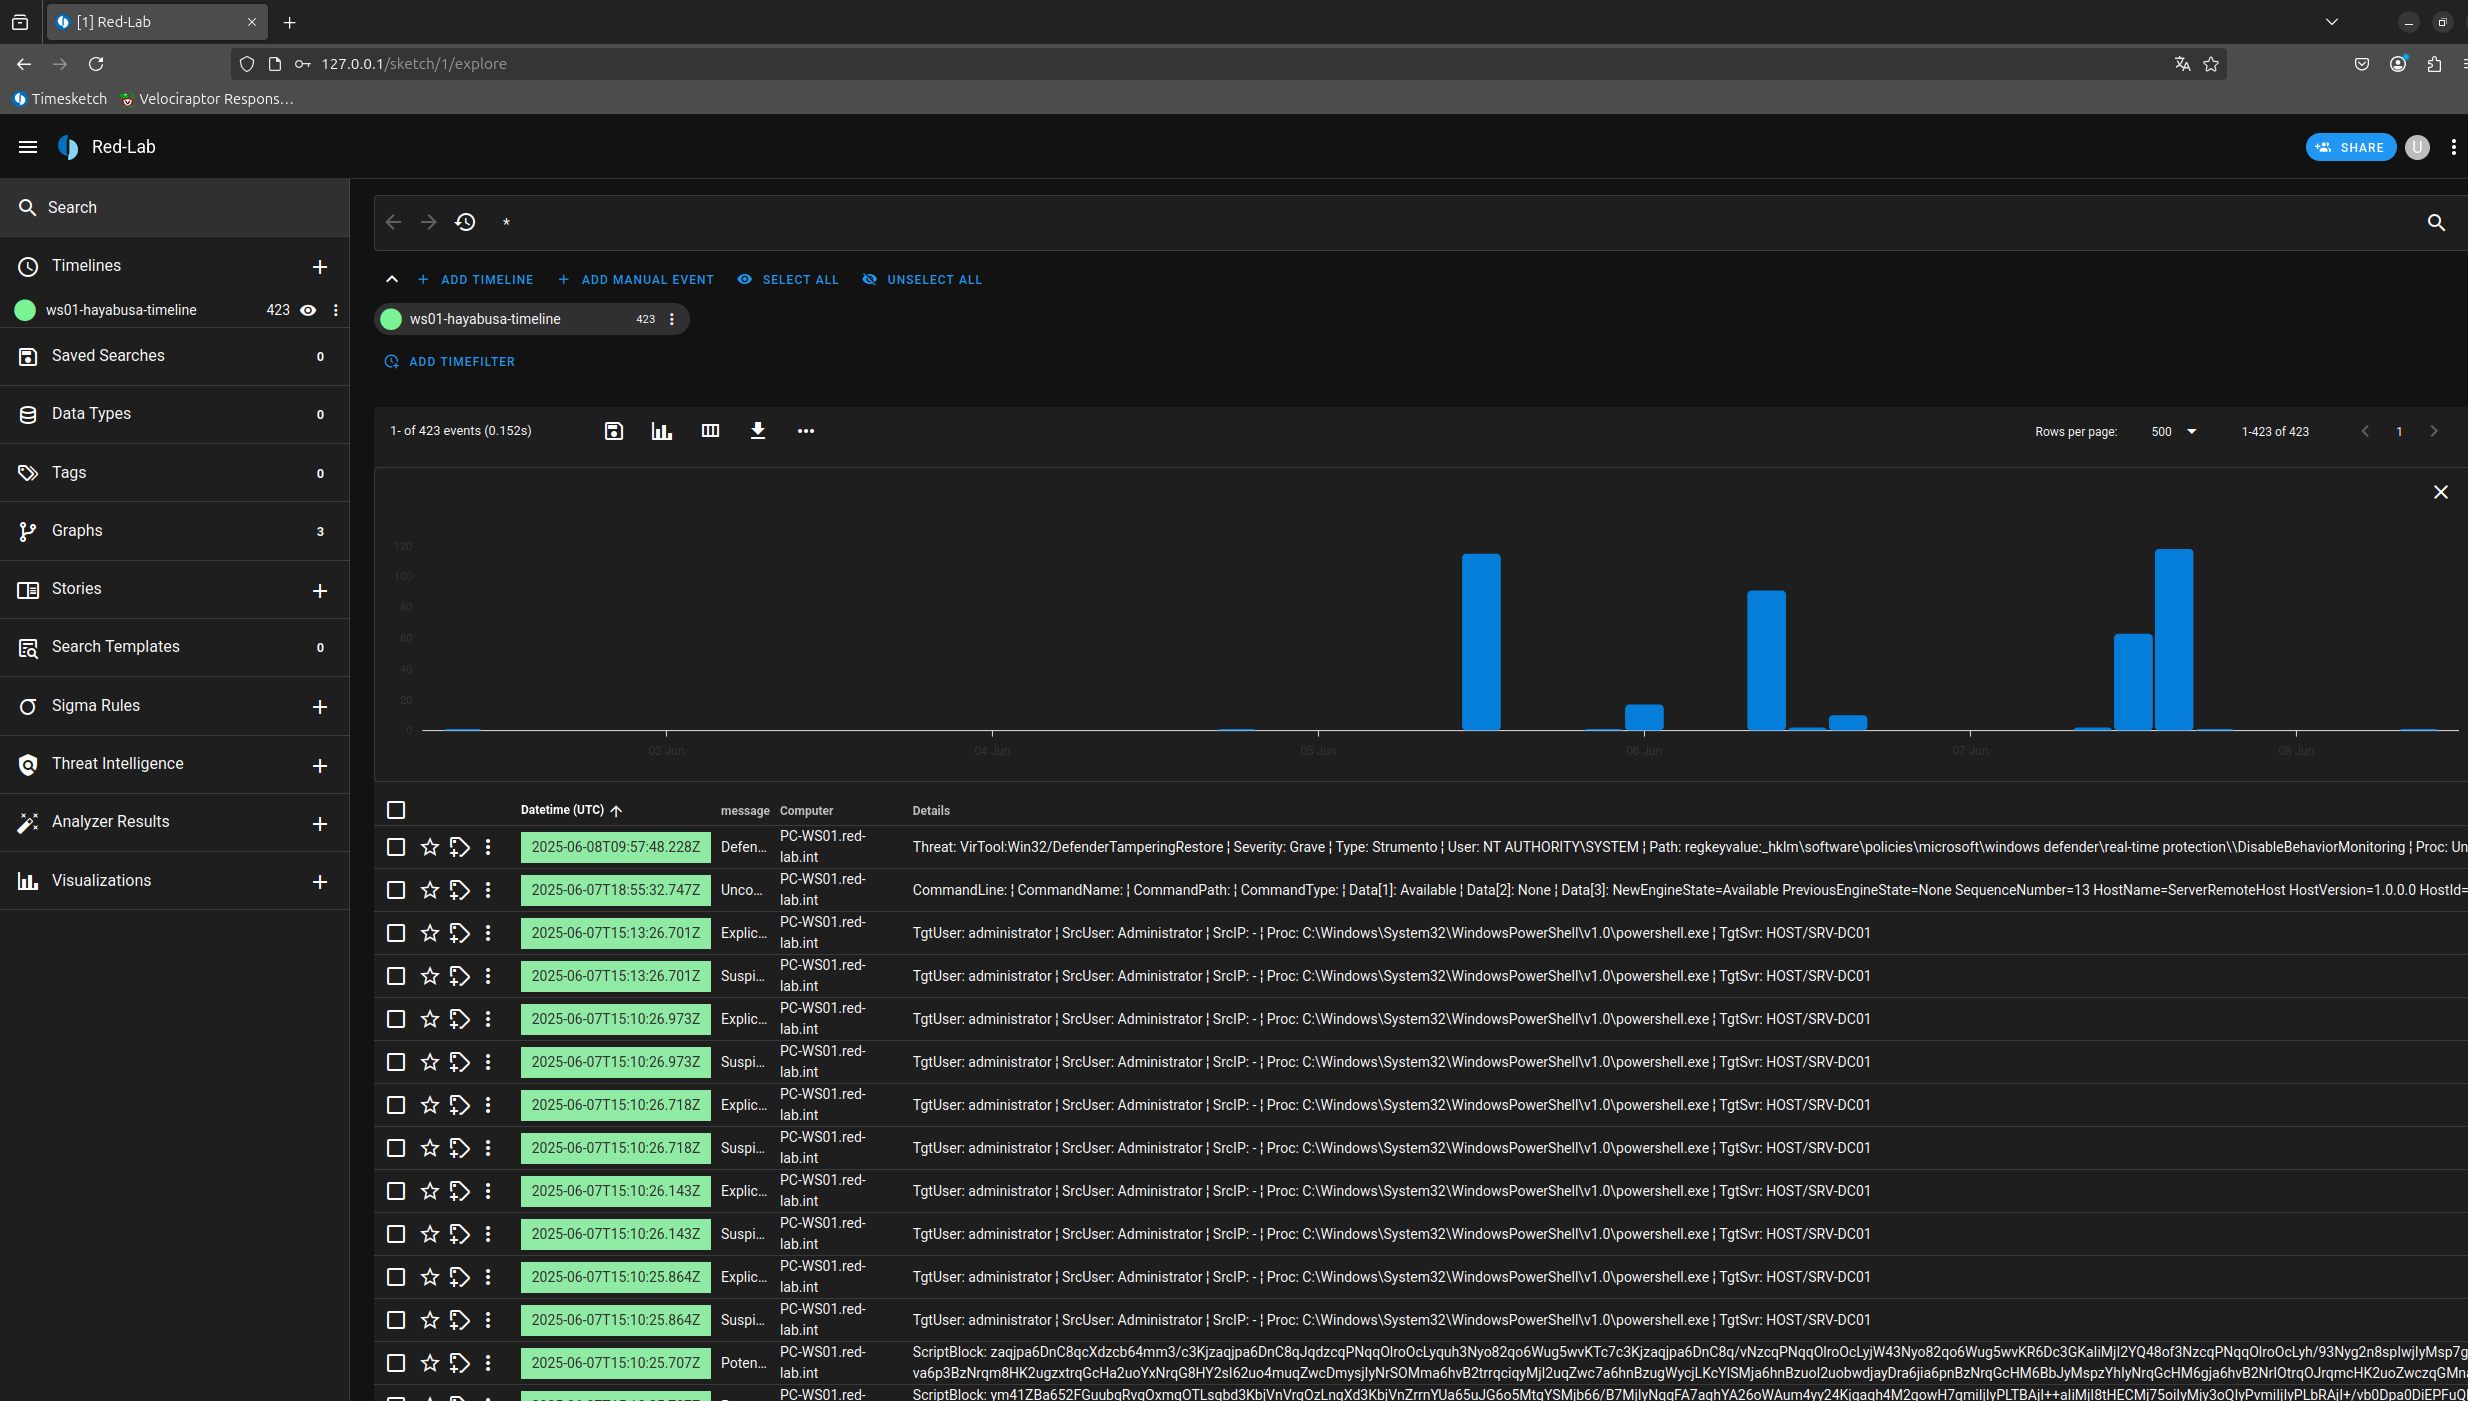
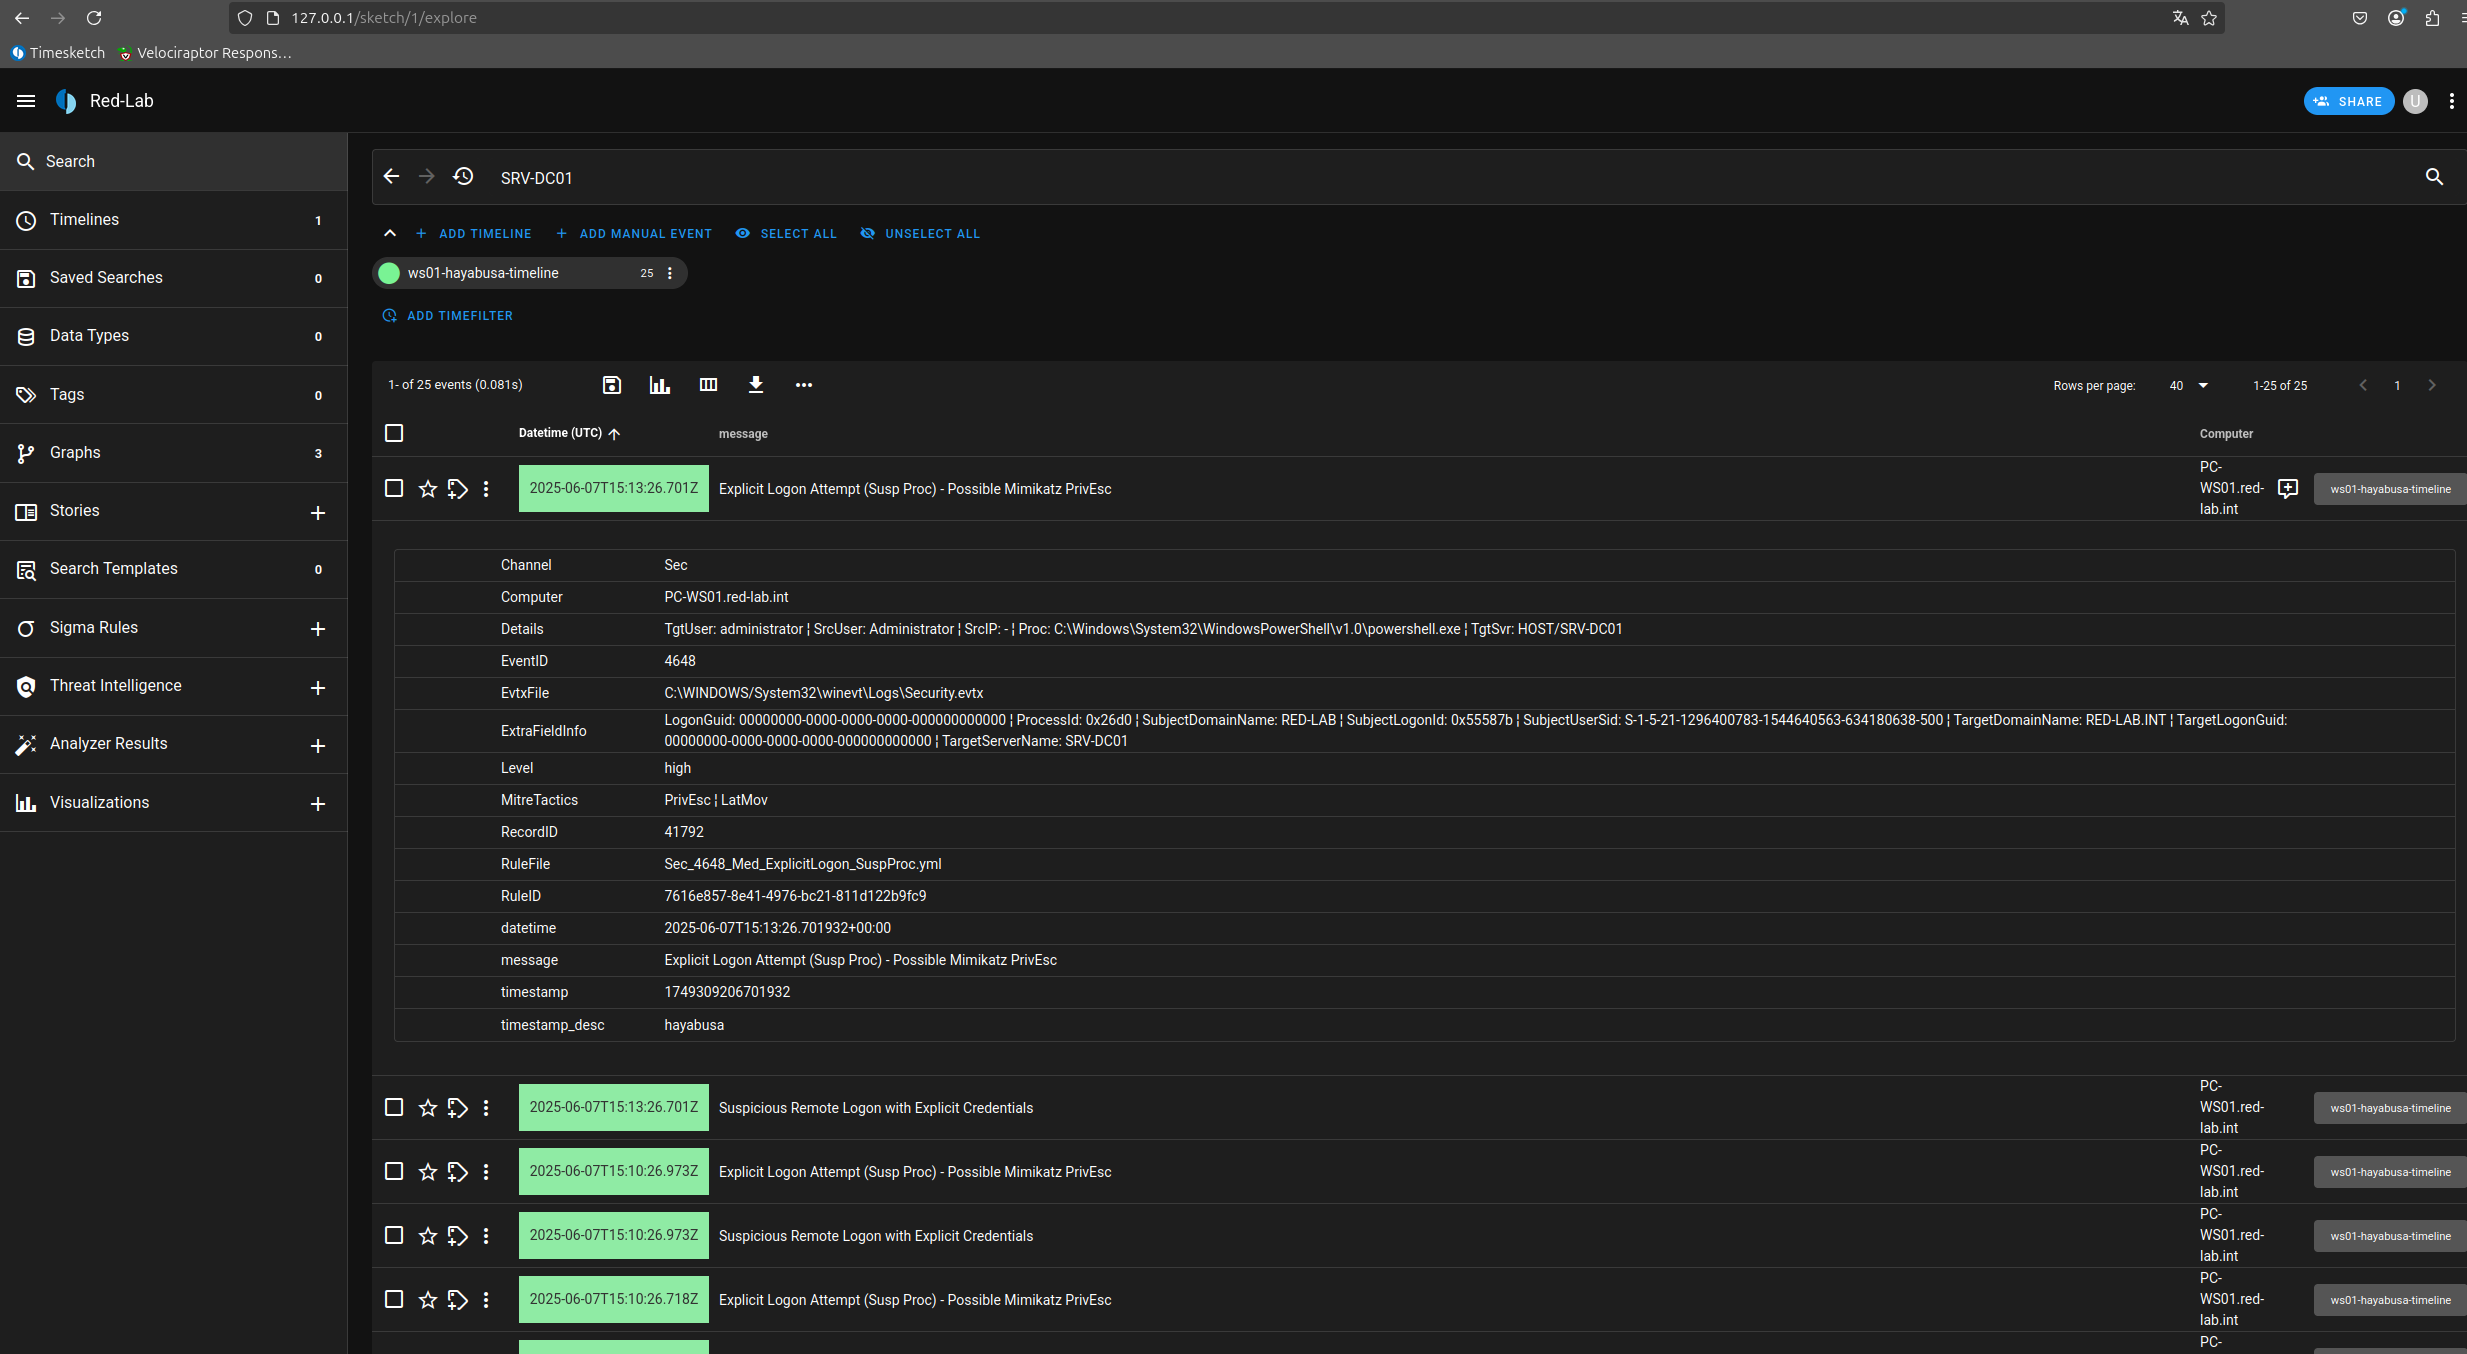
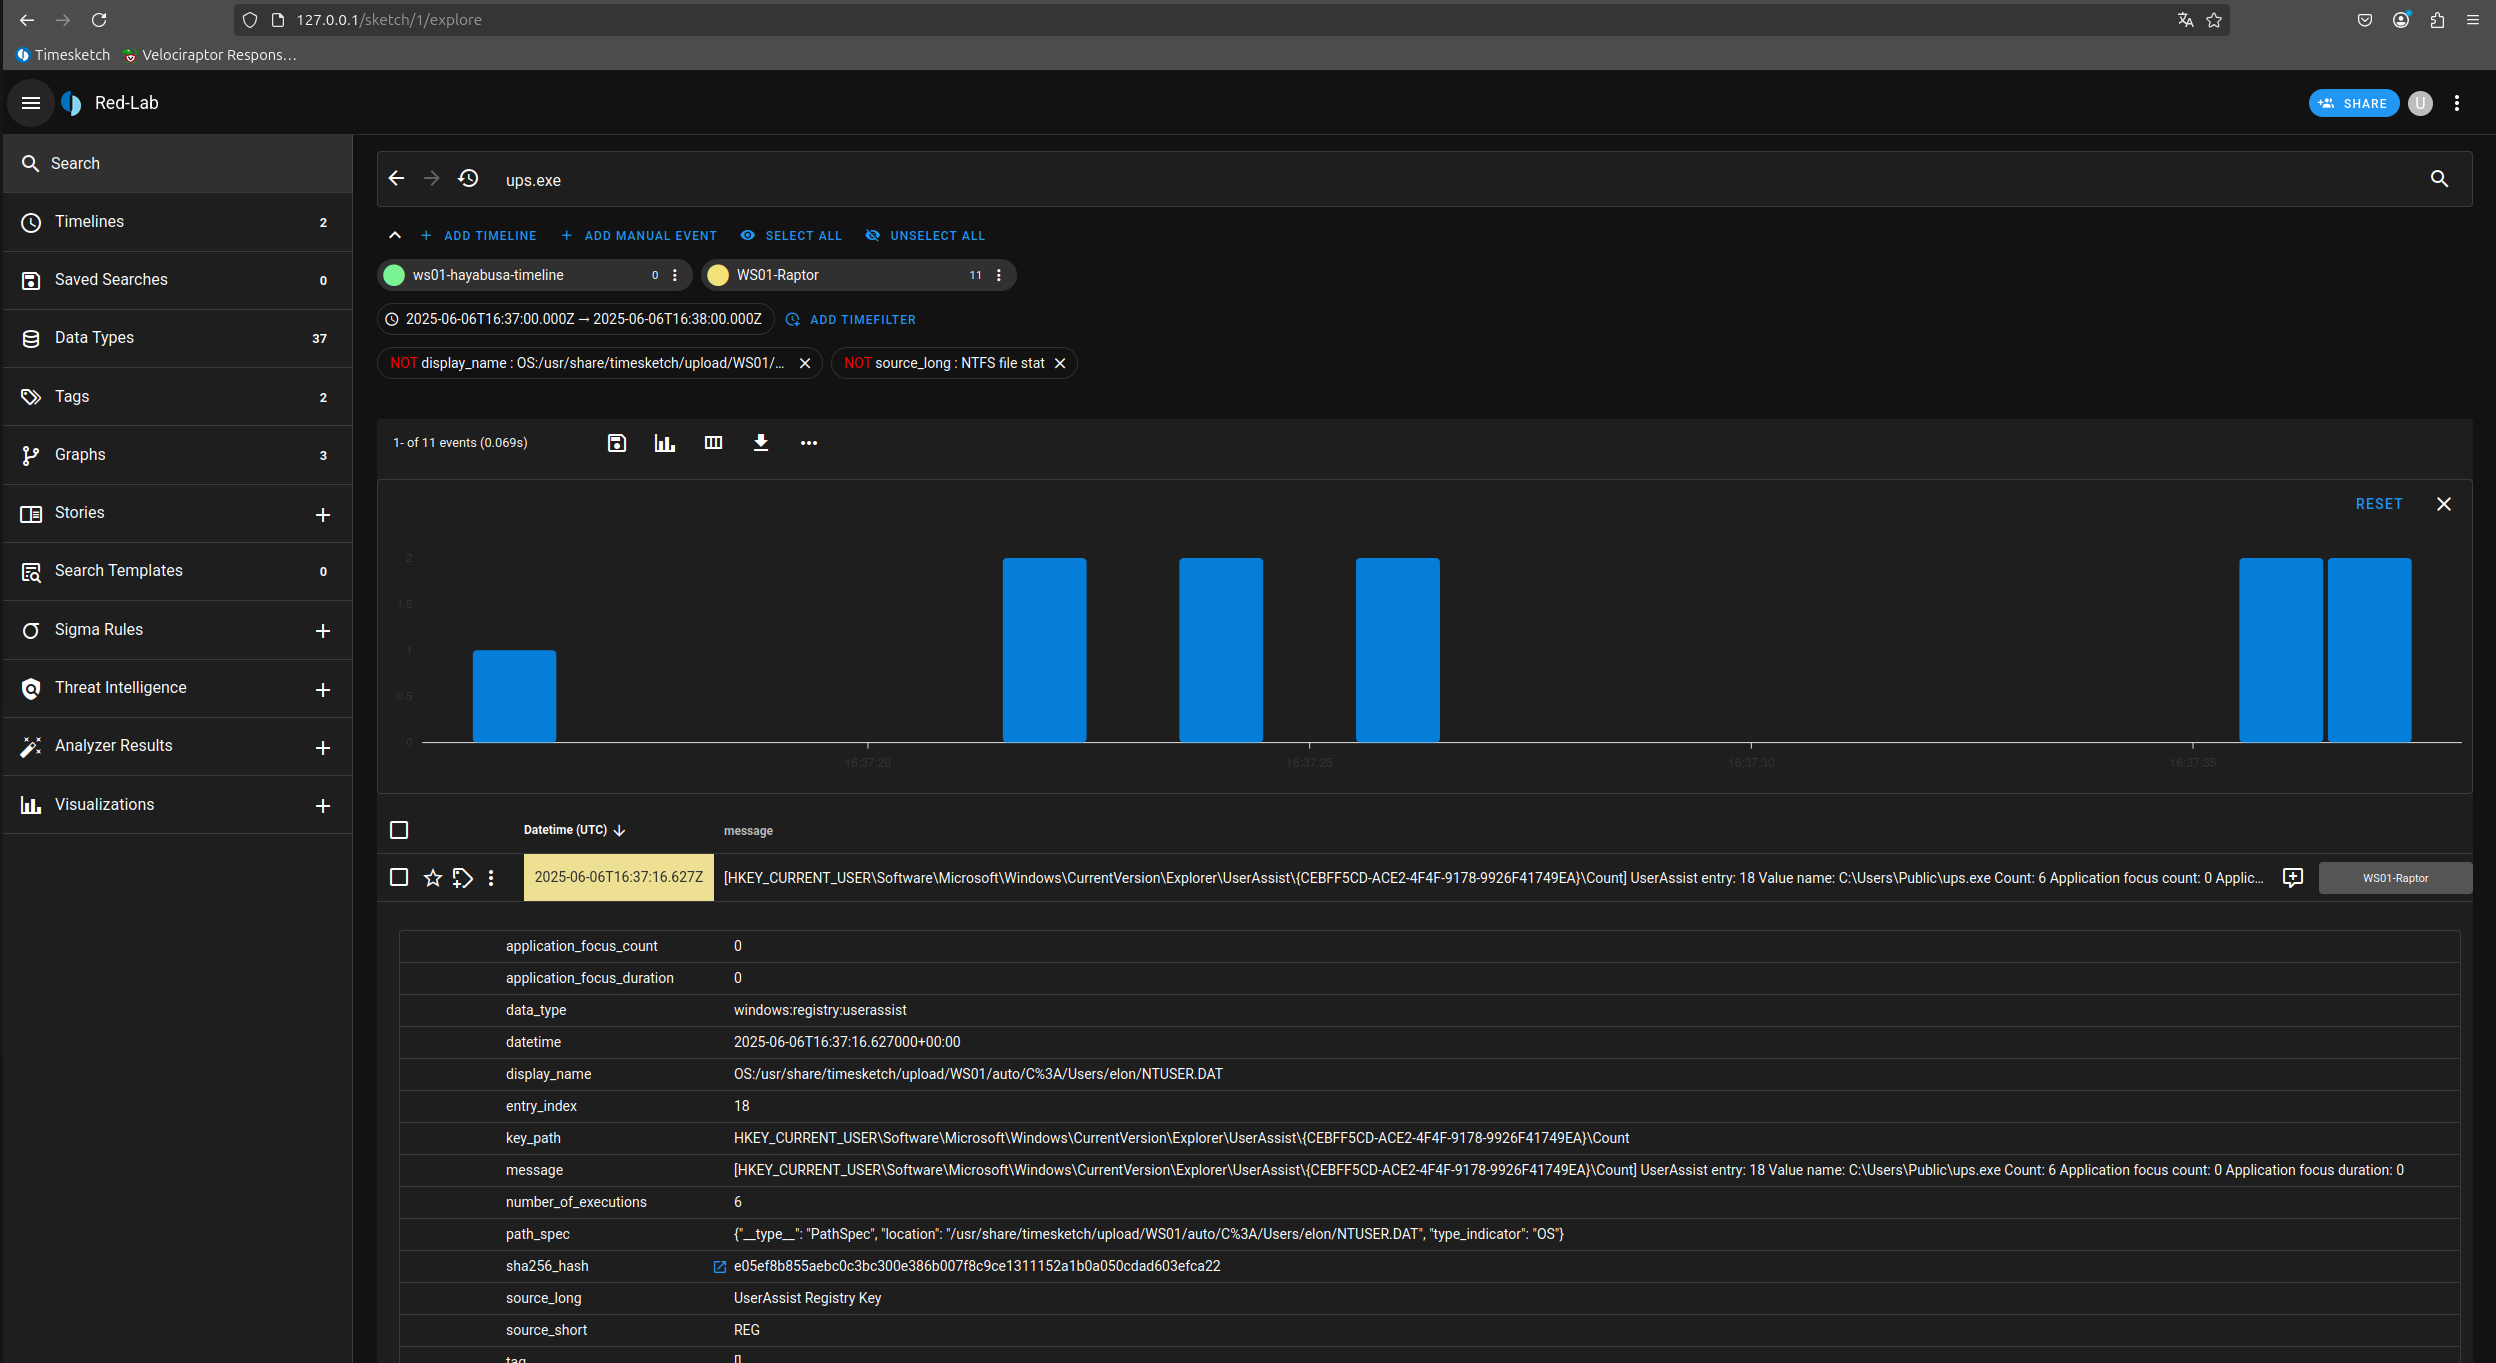
Here is our visualization in Timesketch of the timeline generated with Hayabusa. In Timesketch, each imported timeline is referred to as a sketch, one of the platform’s core concepts. Multiple sketches can be created and managed together within a single case, allowing for collaborative analysis and correlation of different timelines.
2 - Acquisition with Velociraptor and Import into Timesketch
Let’s now move on to the other approach: we will use Velociraptor to acquire the necessary artifacts for triage and then generate the timeline using plaso before importing it into Timesketch.
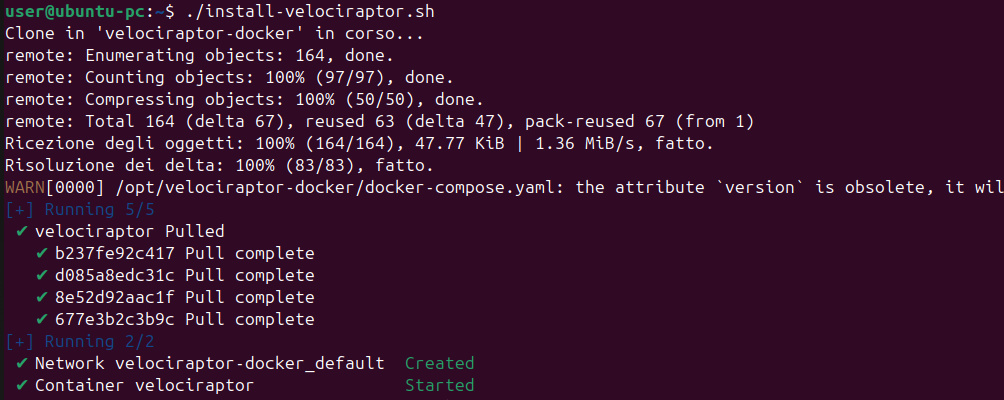
Let’s start by deploying the Velociraptor Server using Docker on our Ubuntu machine:
user@ubuntu-pc:~$ cat install-velociraptor.sh

#!/bin/bash

cd /opt/
sudo git clone https://github.com/weslambert/velociraptor-docker
cd velociraptor-docker
sudo docker compose up -d

# Default configuration
# admin::admin

# To create other users
# sudo docker exec -it velociraptor ./velociraptor --config server.config.yaml user add user1 user1 --role administrator
By default, the credentials are admin::admin. These credentials, as well as other environment variables, can be changed in the .env file of the repository.
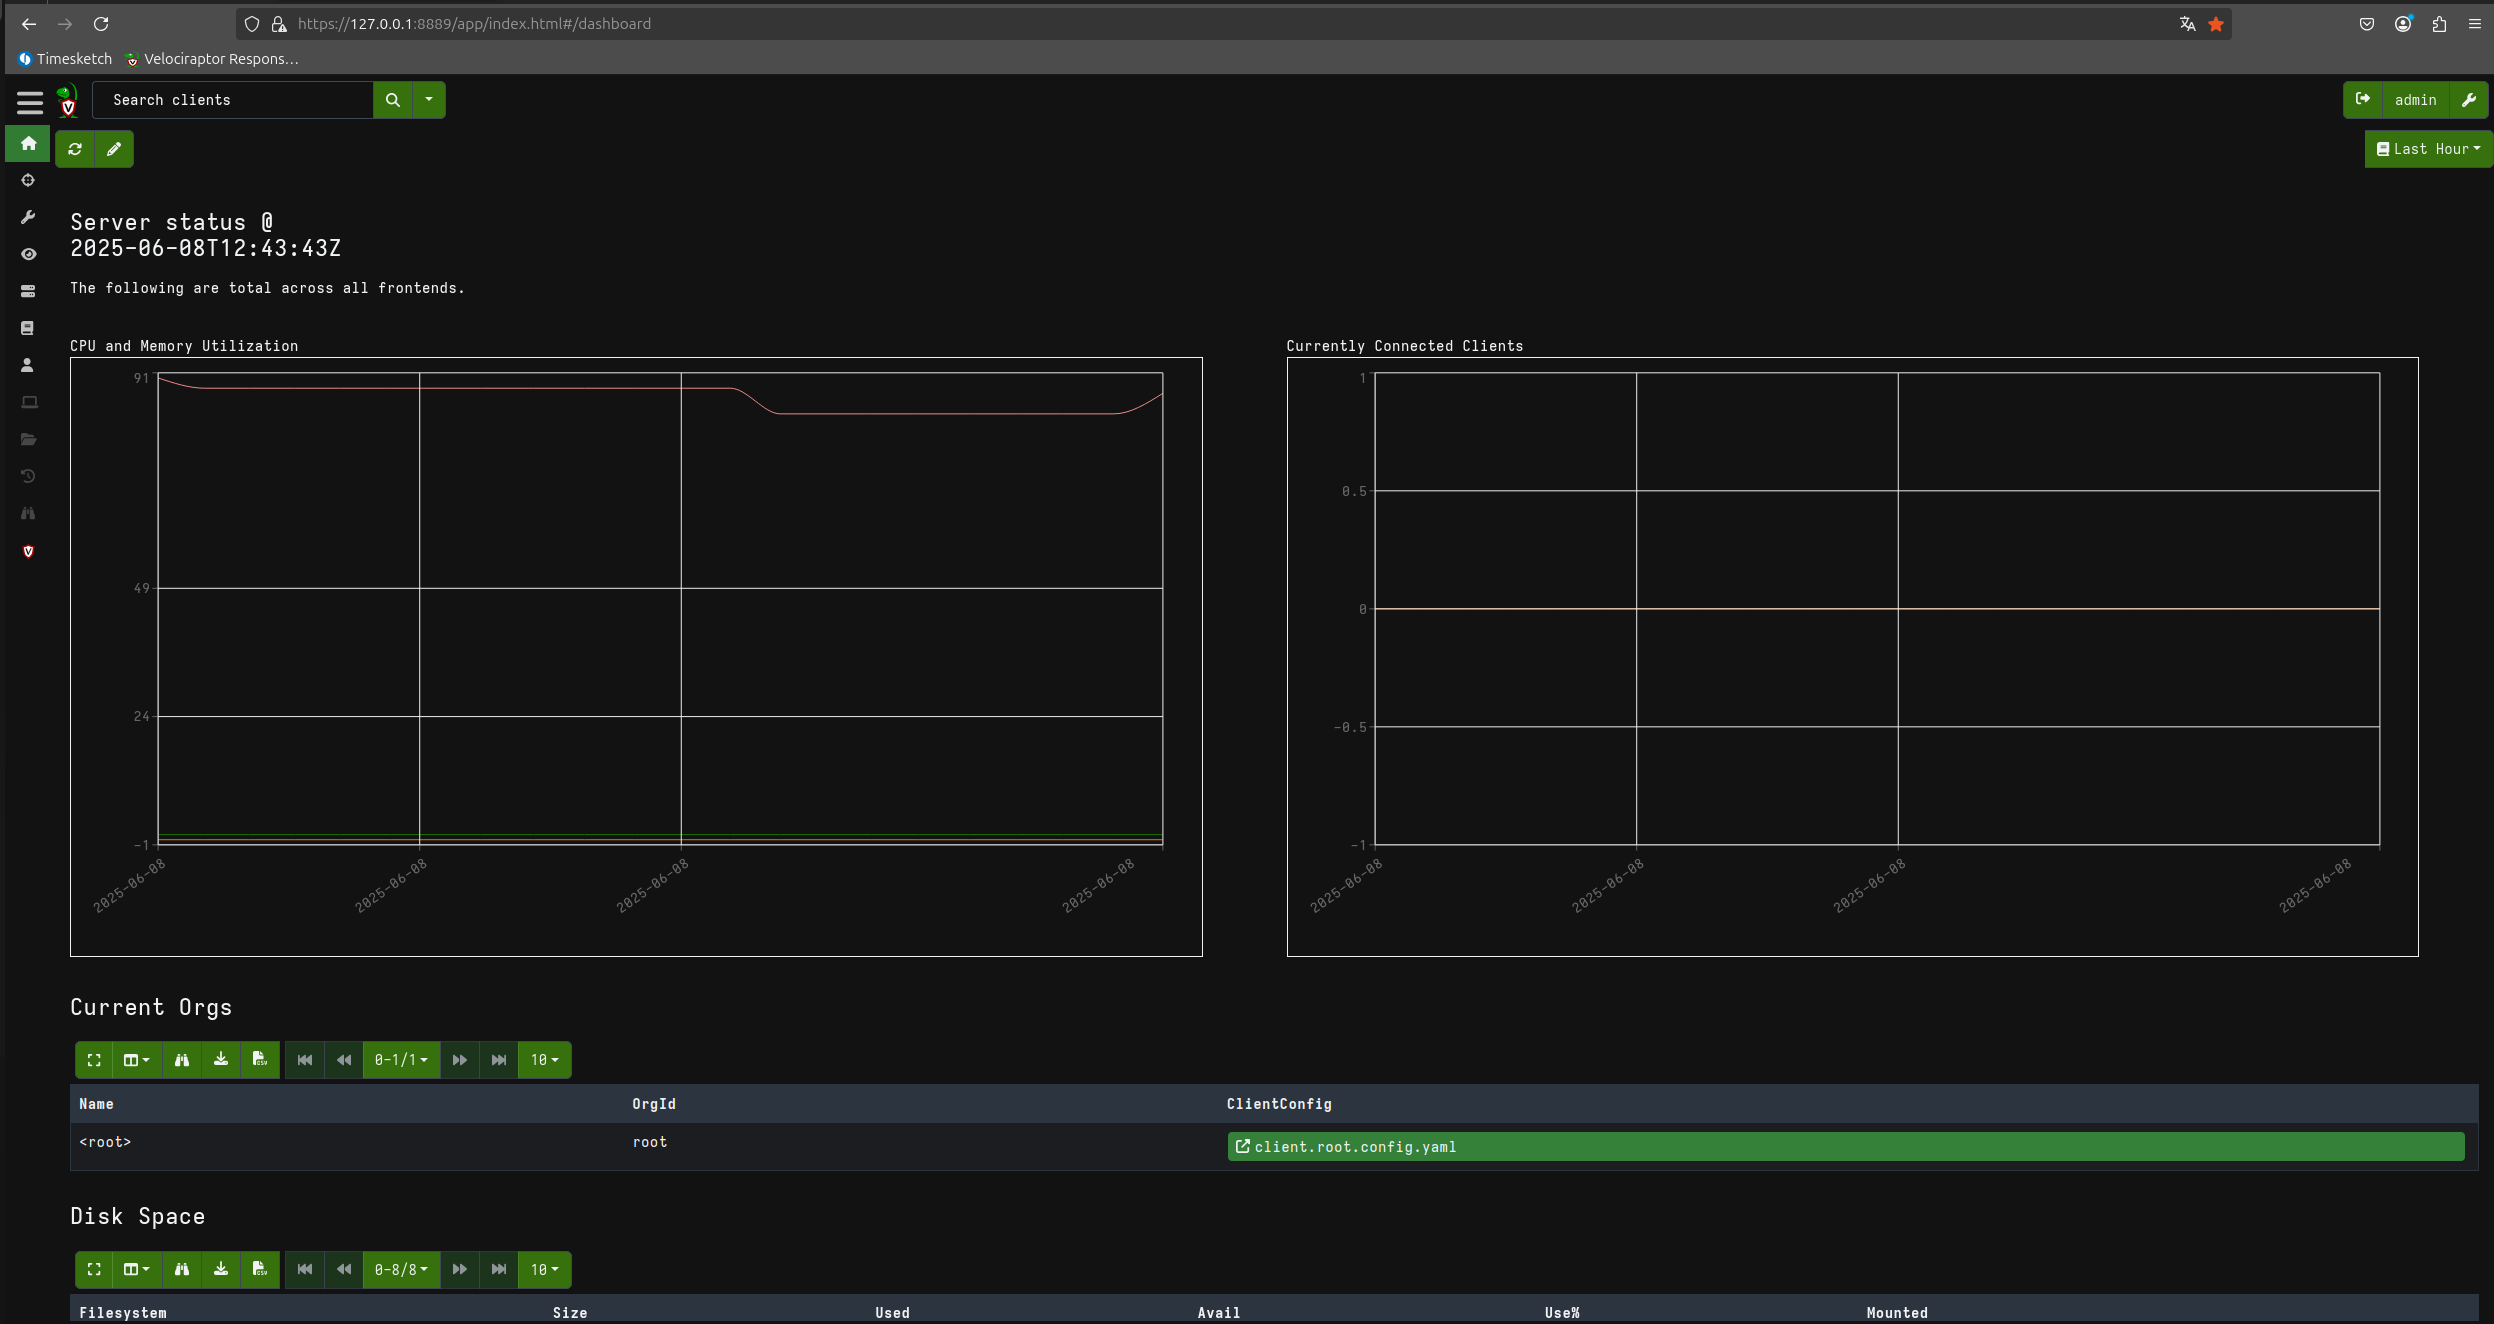
Here is our Velociraptor server up and running.
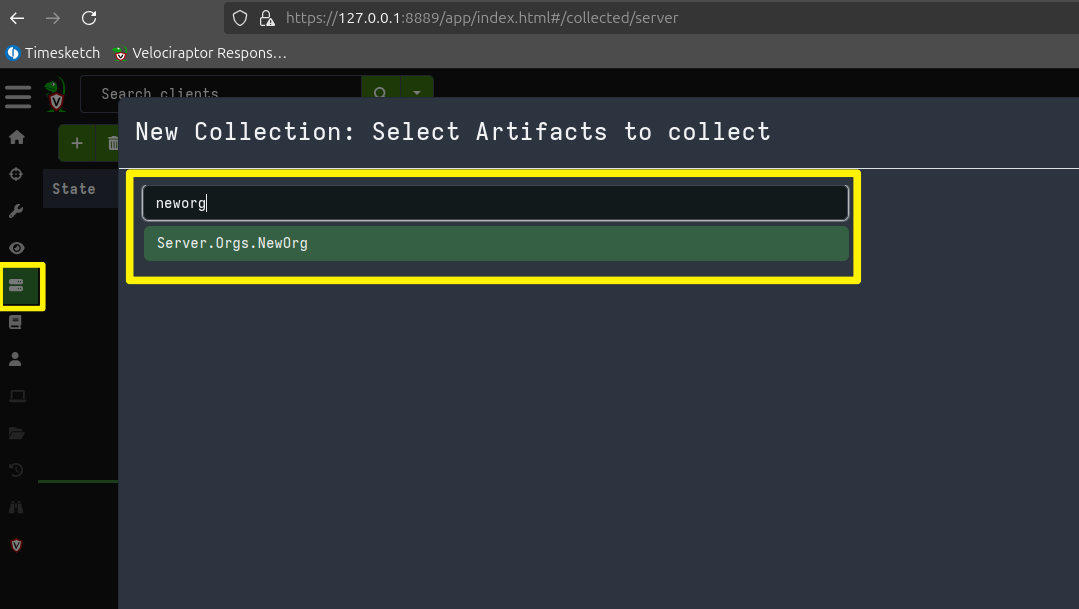
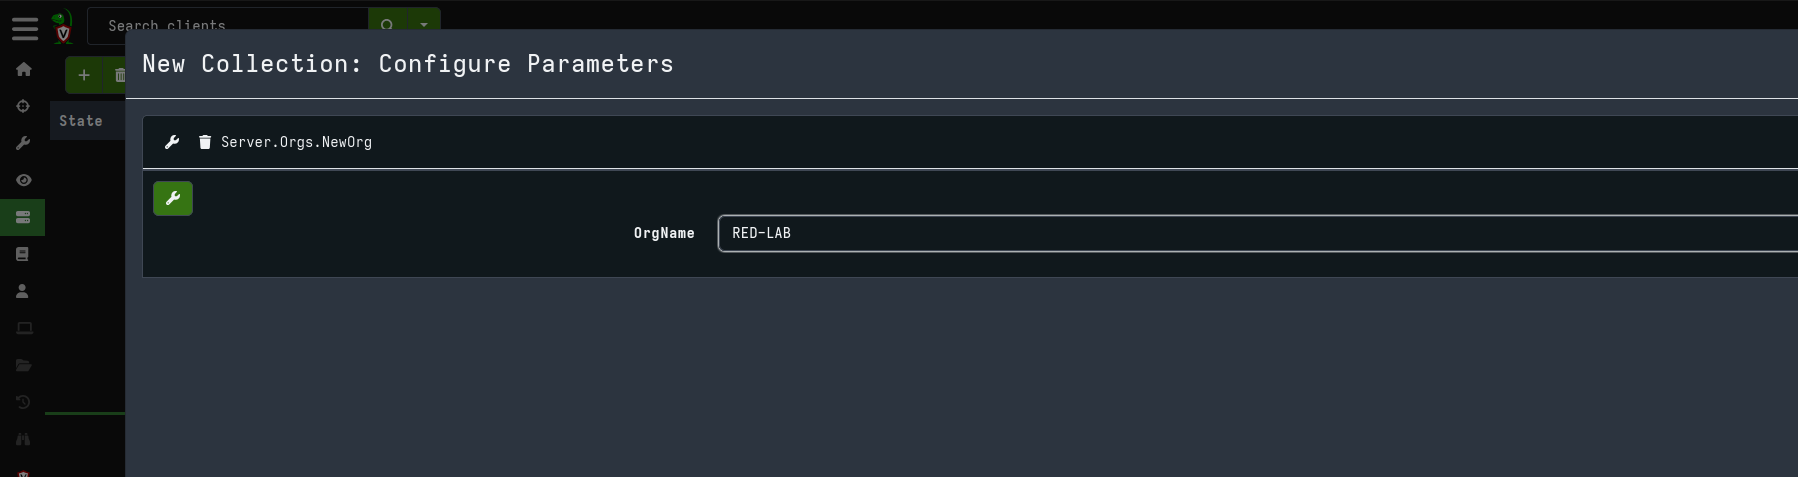
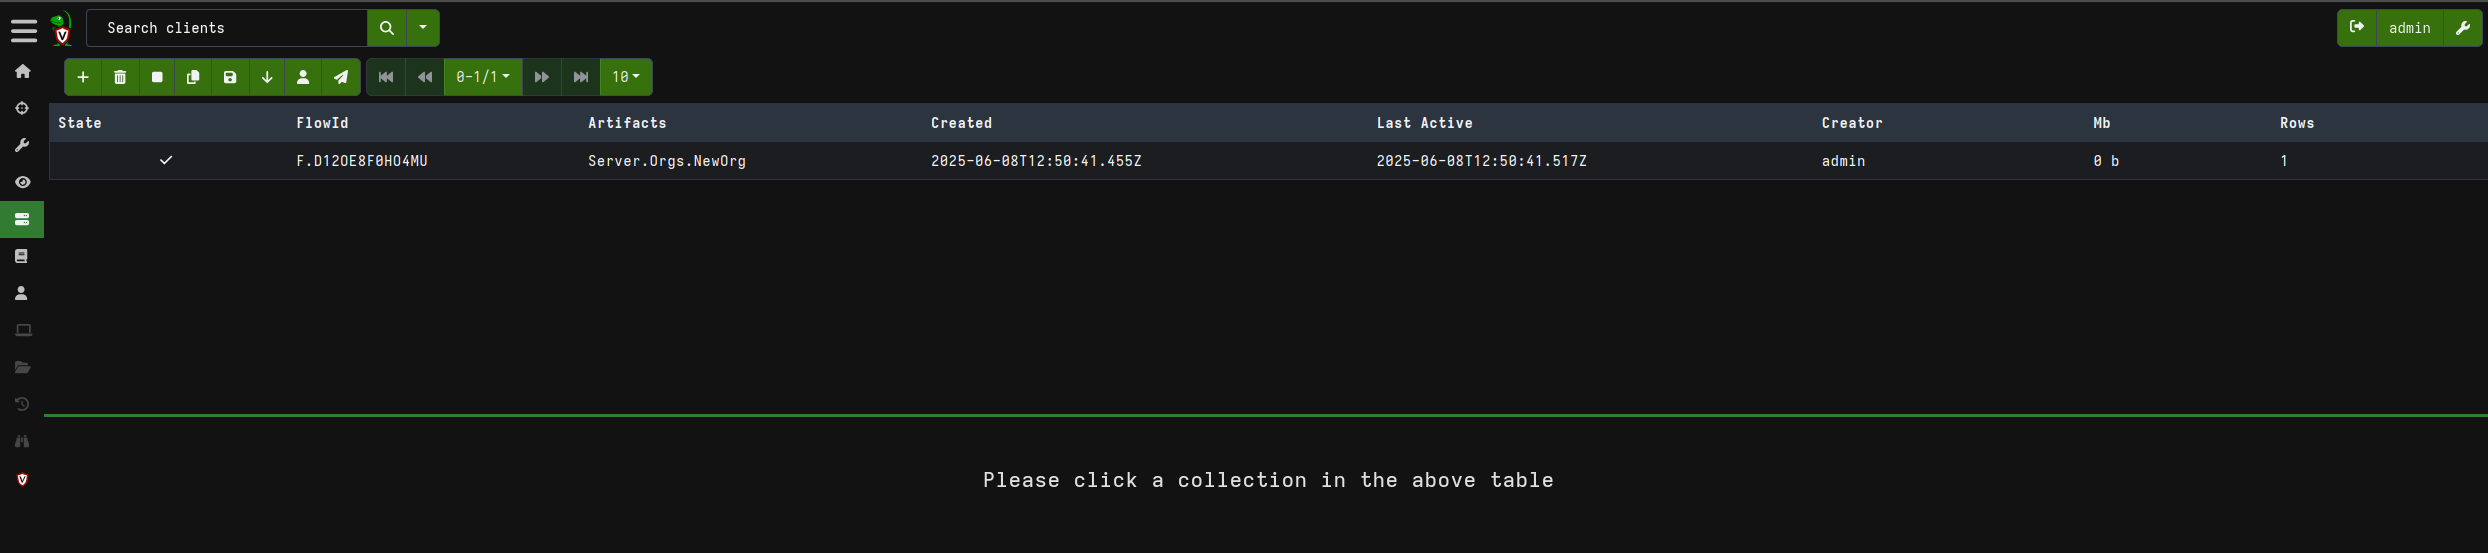
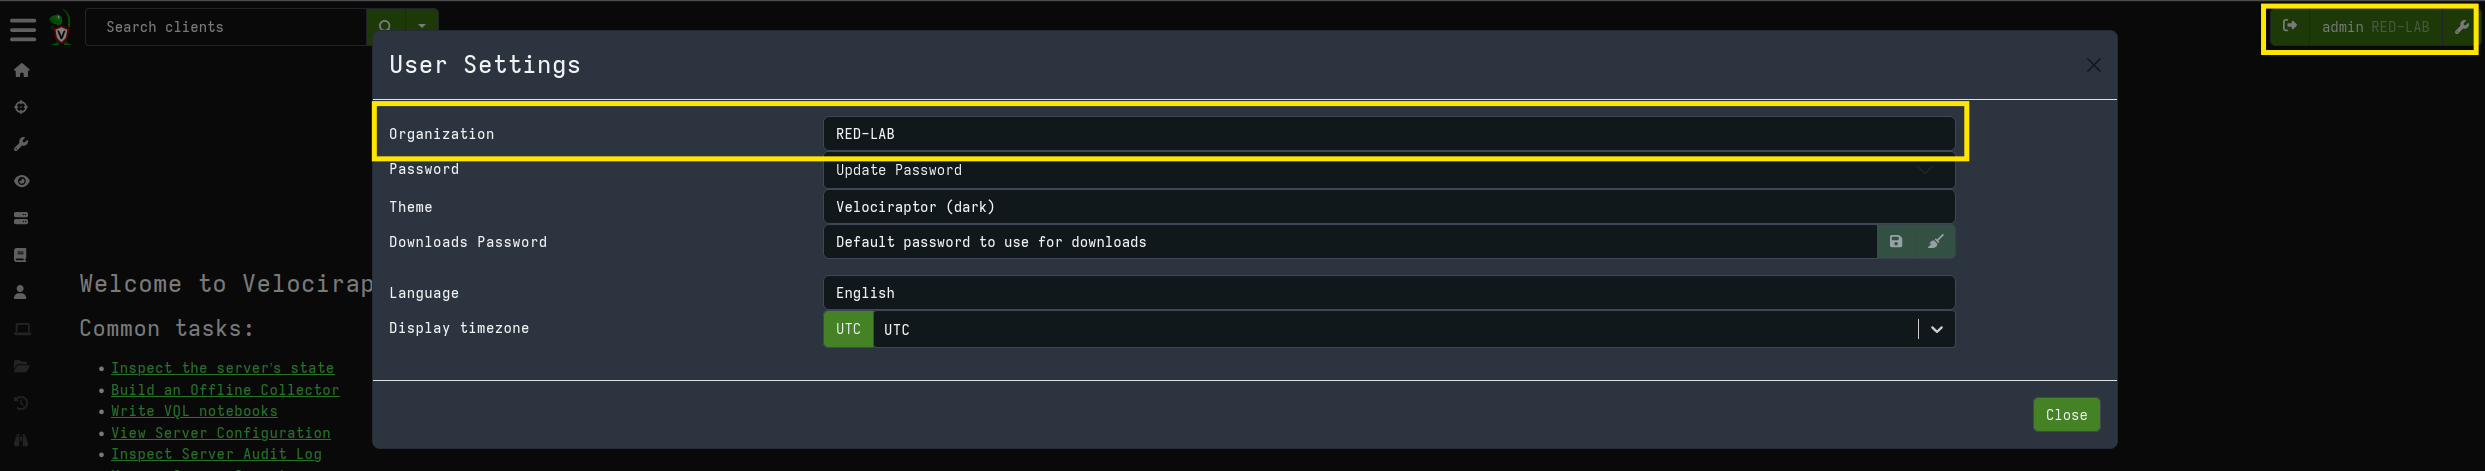
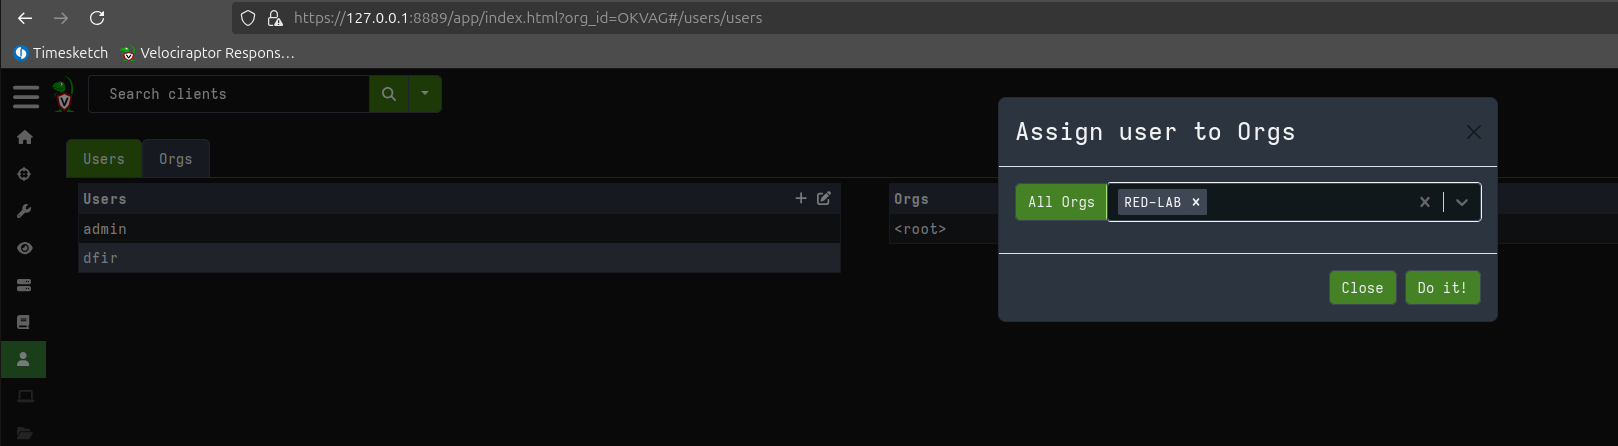
The first thing we will do is create a new organization instead of using the default “root” organization:
Now, returning to the Home page, you will find the newly created organization:
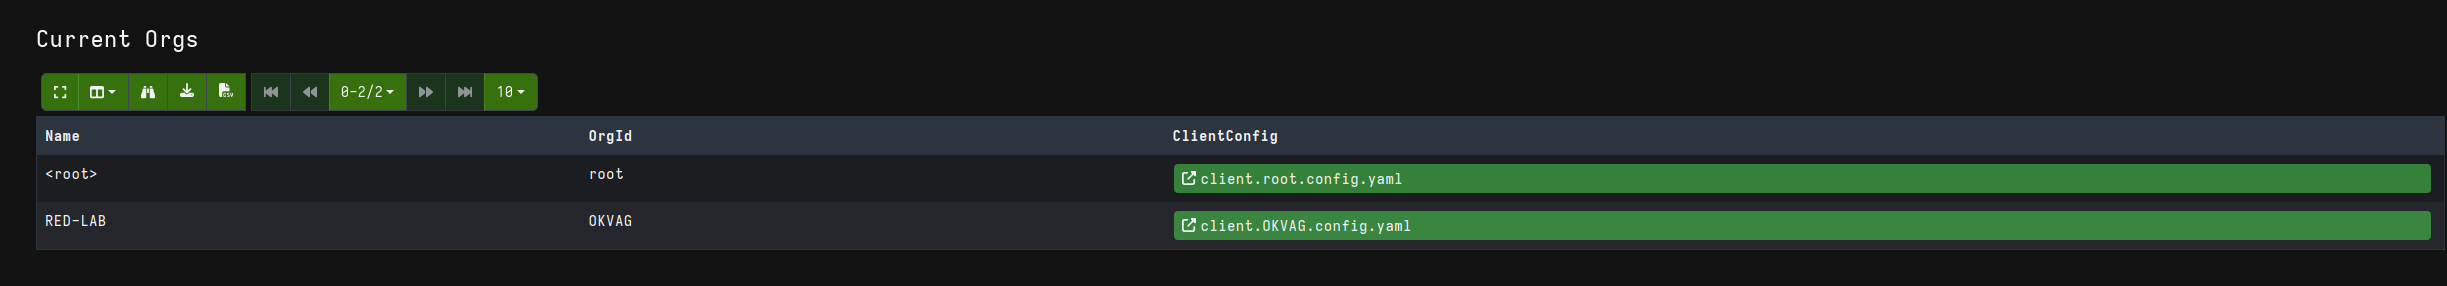
By clicking on the user icon and selecting the new organization, you will see that the context switches to the selected organization. This applies to other operations as well, which will now use the new organization as their reference context instead of the root organization.
Now that we have finished configuring the server, we need to install the Velociraptor Client on the machines we want to acquire. This can be done using the Velociraptor executable, which can be downloaded from the official website
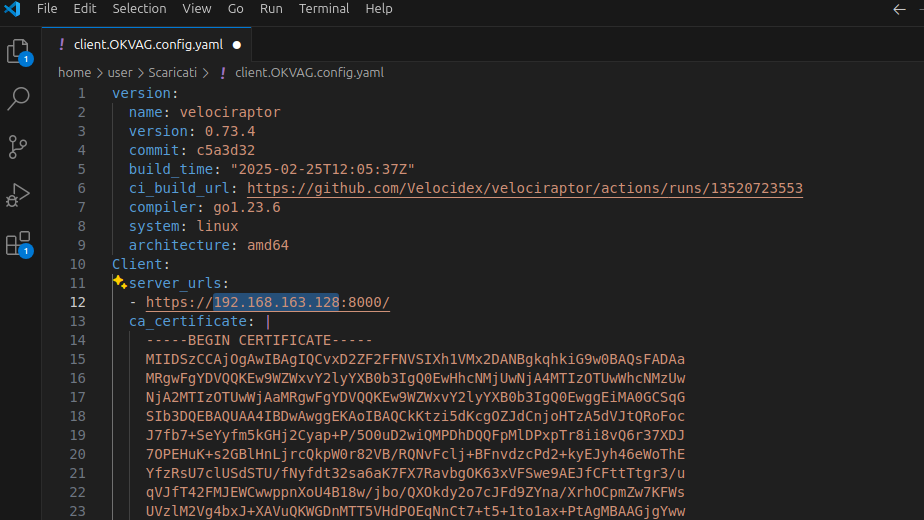
The executable must be launched by providing it with the configuration file for your organization:

In the configuration file, make sure that the server address or URL is correct, and then transfer it to the machine where the installation will take place.
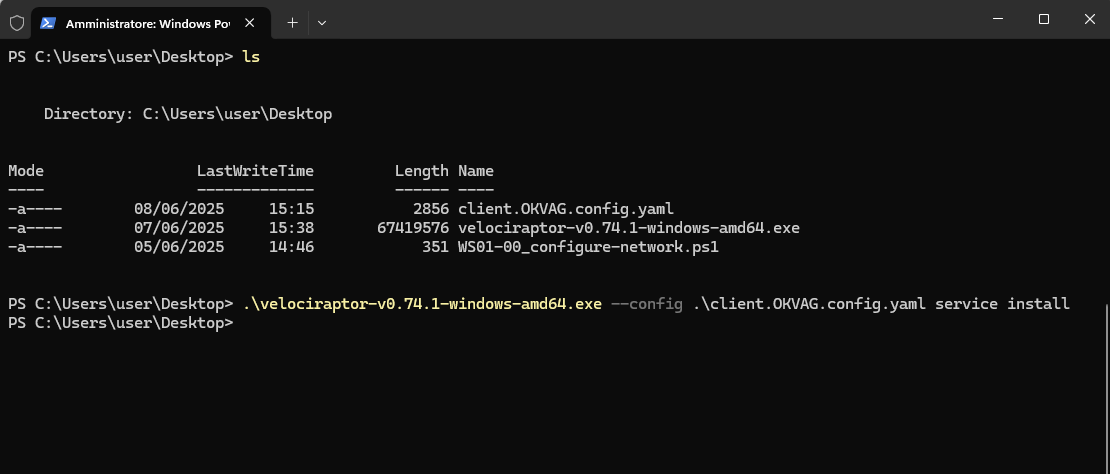
The command to install Velociraptor as a service is as follows:
.\velociraptor-v0.74.1-windows-amd64.exe --config .\client.OKVAG.config.yaml service install
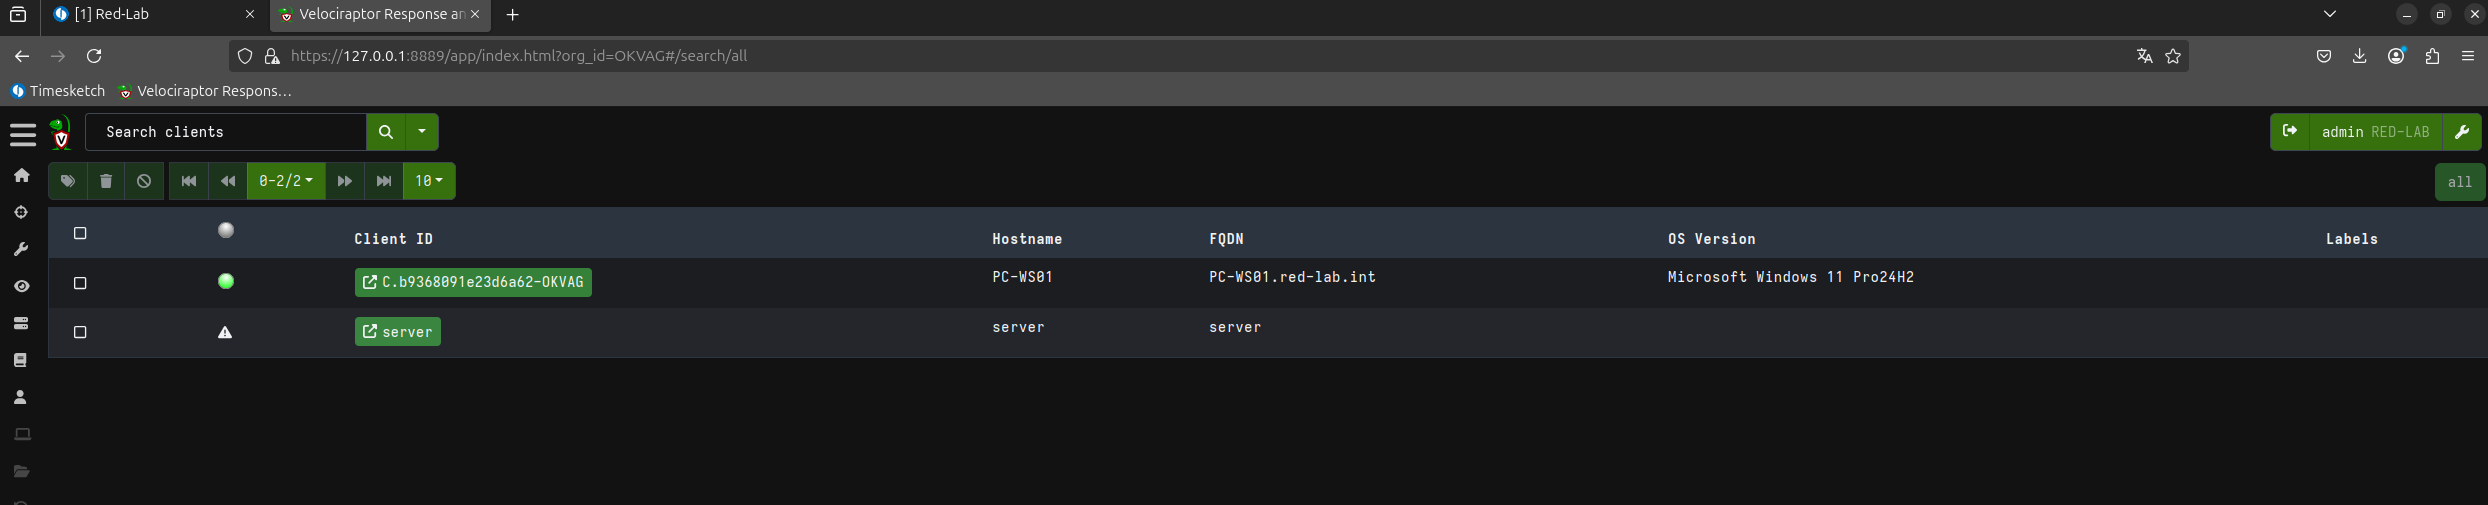 Here is our client successfully connected to our server.
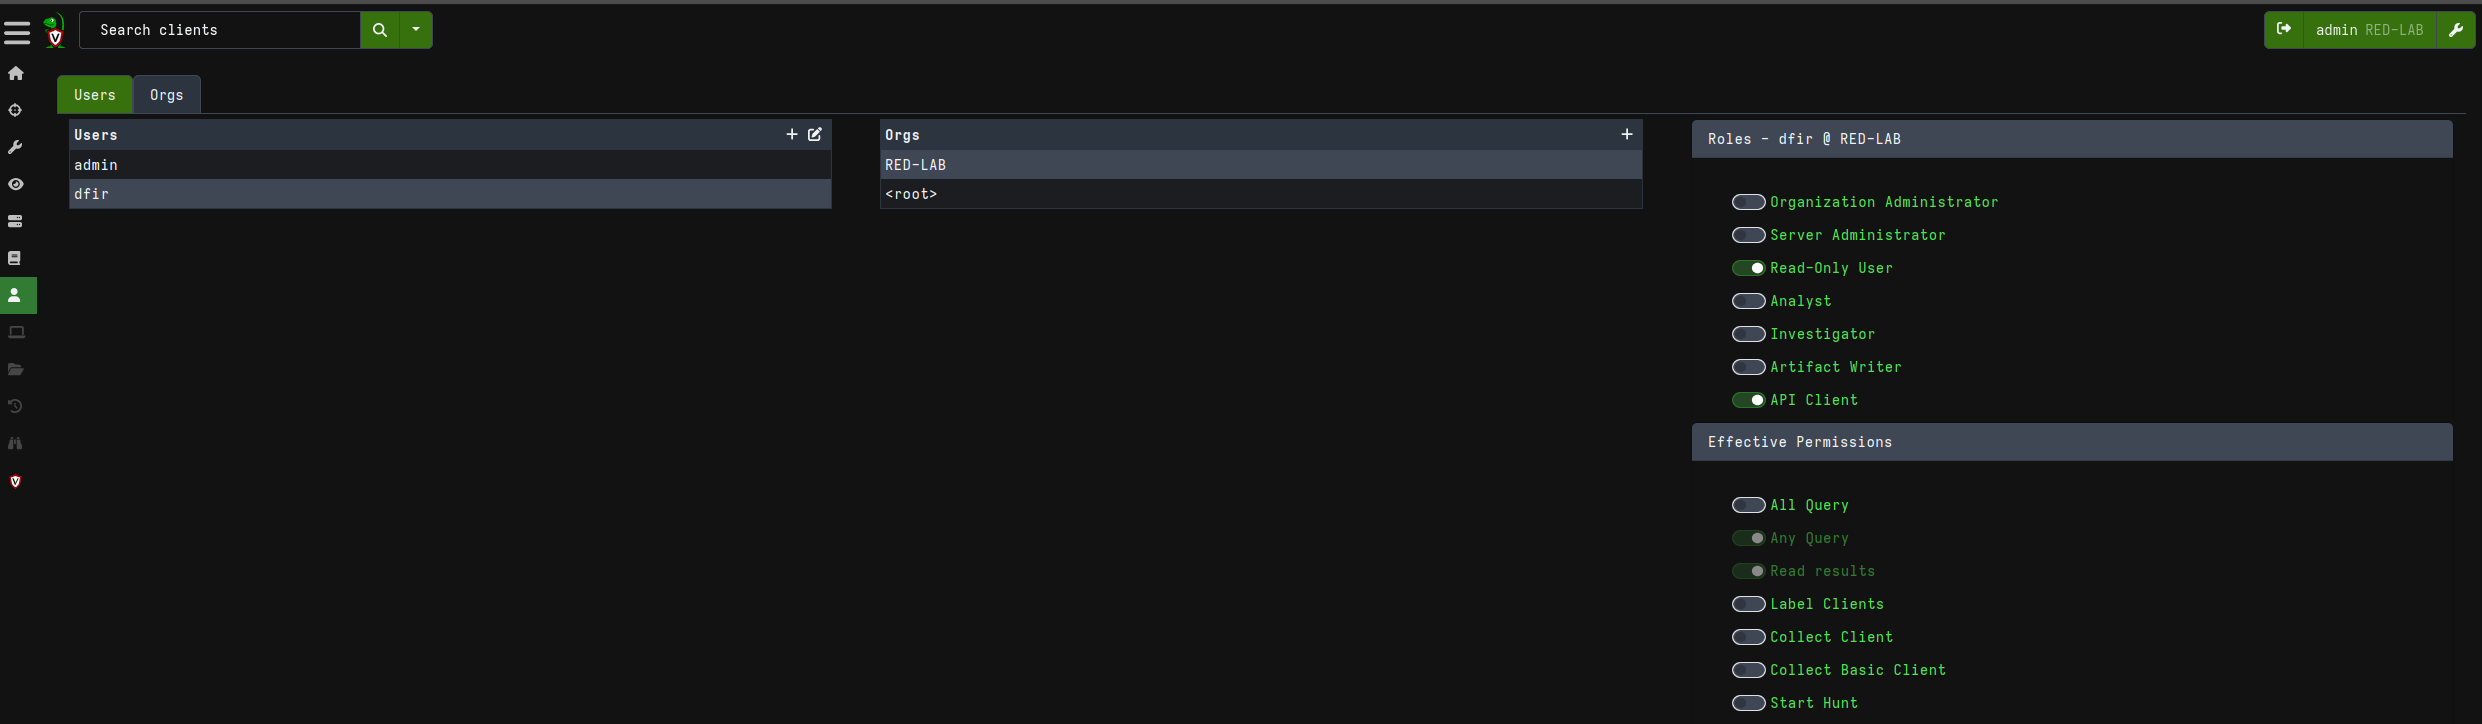
Now let’s create a configuration for our API calls. Since Velociraptor uses gRPC calls instead of classic HTTP REST, we need to create a profile that will allow us to make subsequent API requests.
cd /opt/velociraptor-docker/velociraptor
# velociraptor is velociraptor linux executable
# a new user with role api
sudo ./velociraptor --config server.config.yaml user add --role=api dfir
cd ../../
sudo docker compose restart

sudo ./velociraptor --config server.config.yaml config api_client --name dfir --role administrator api.config.yaml
sudo ./velociraptor --api_config api.config.yaml query "SELECT *
FROM foreach(row={
   SELECT OrgId
   FROM orgs()
},  query={
   SELECT *, OrgId
   FROM query(query={ SELECT client_id FROM clients() }, org_id=OrgId)
})" --format jsonl | jq

sudo ./velociraptor --api_config api.config.yaml query "
SELECT *
FROM query(
  query={ SELECT * FROM clients() WHERE client_id = 'C.b9368091e23d6a62-OKVAG' },
  org_id='OKVAG'
)
" --format jsonl | jq

sudo ./velociraptor --api_config api.config.yaml query "
SELECT *
FROM query(
  query={ SELECT * FROM clients() WHERE client_id != 'server' AND os_info.system = 'windows' },
  org_id='OKVAG'
)
" --format jsonl | jq .
These queries may be useful later for hunting, checking statuses, or retrieving files. You can also use them to automate processes by integrating them into scripts or workflows.
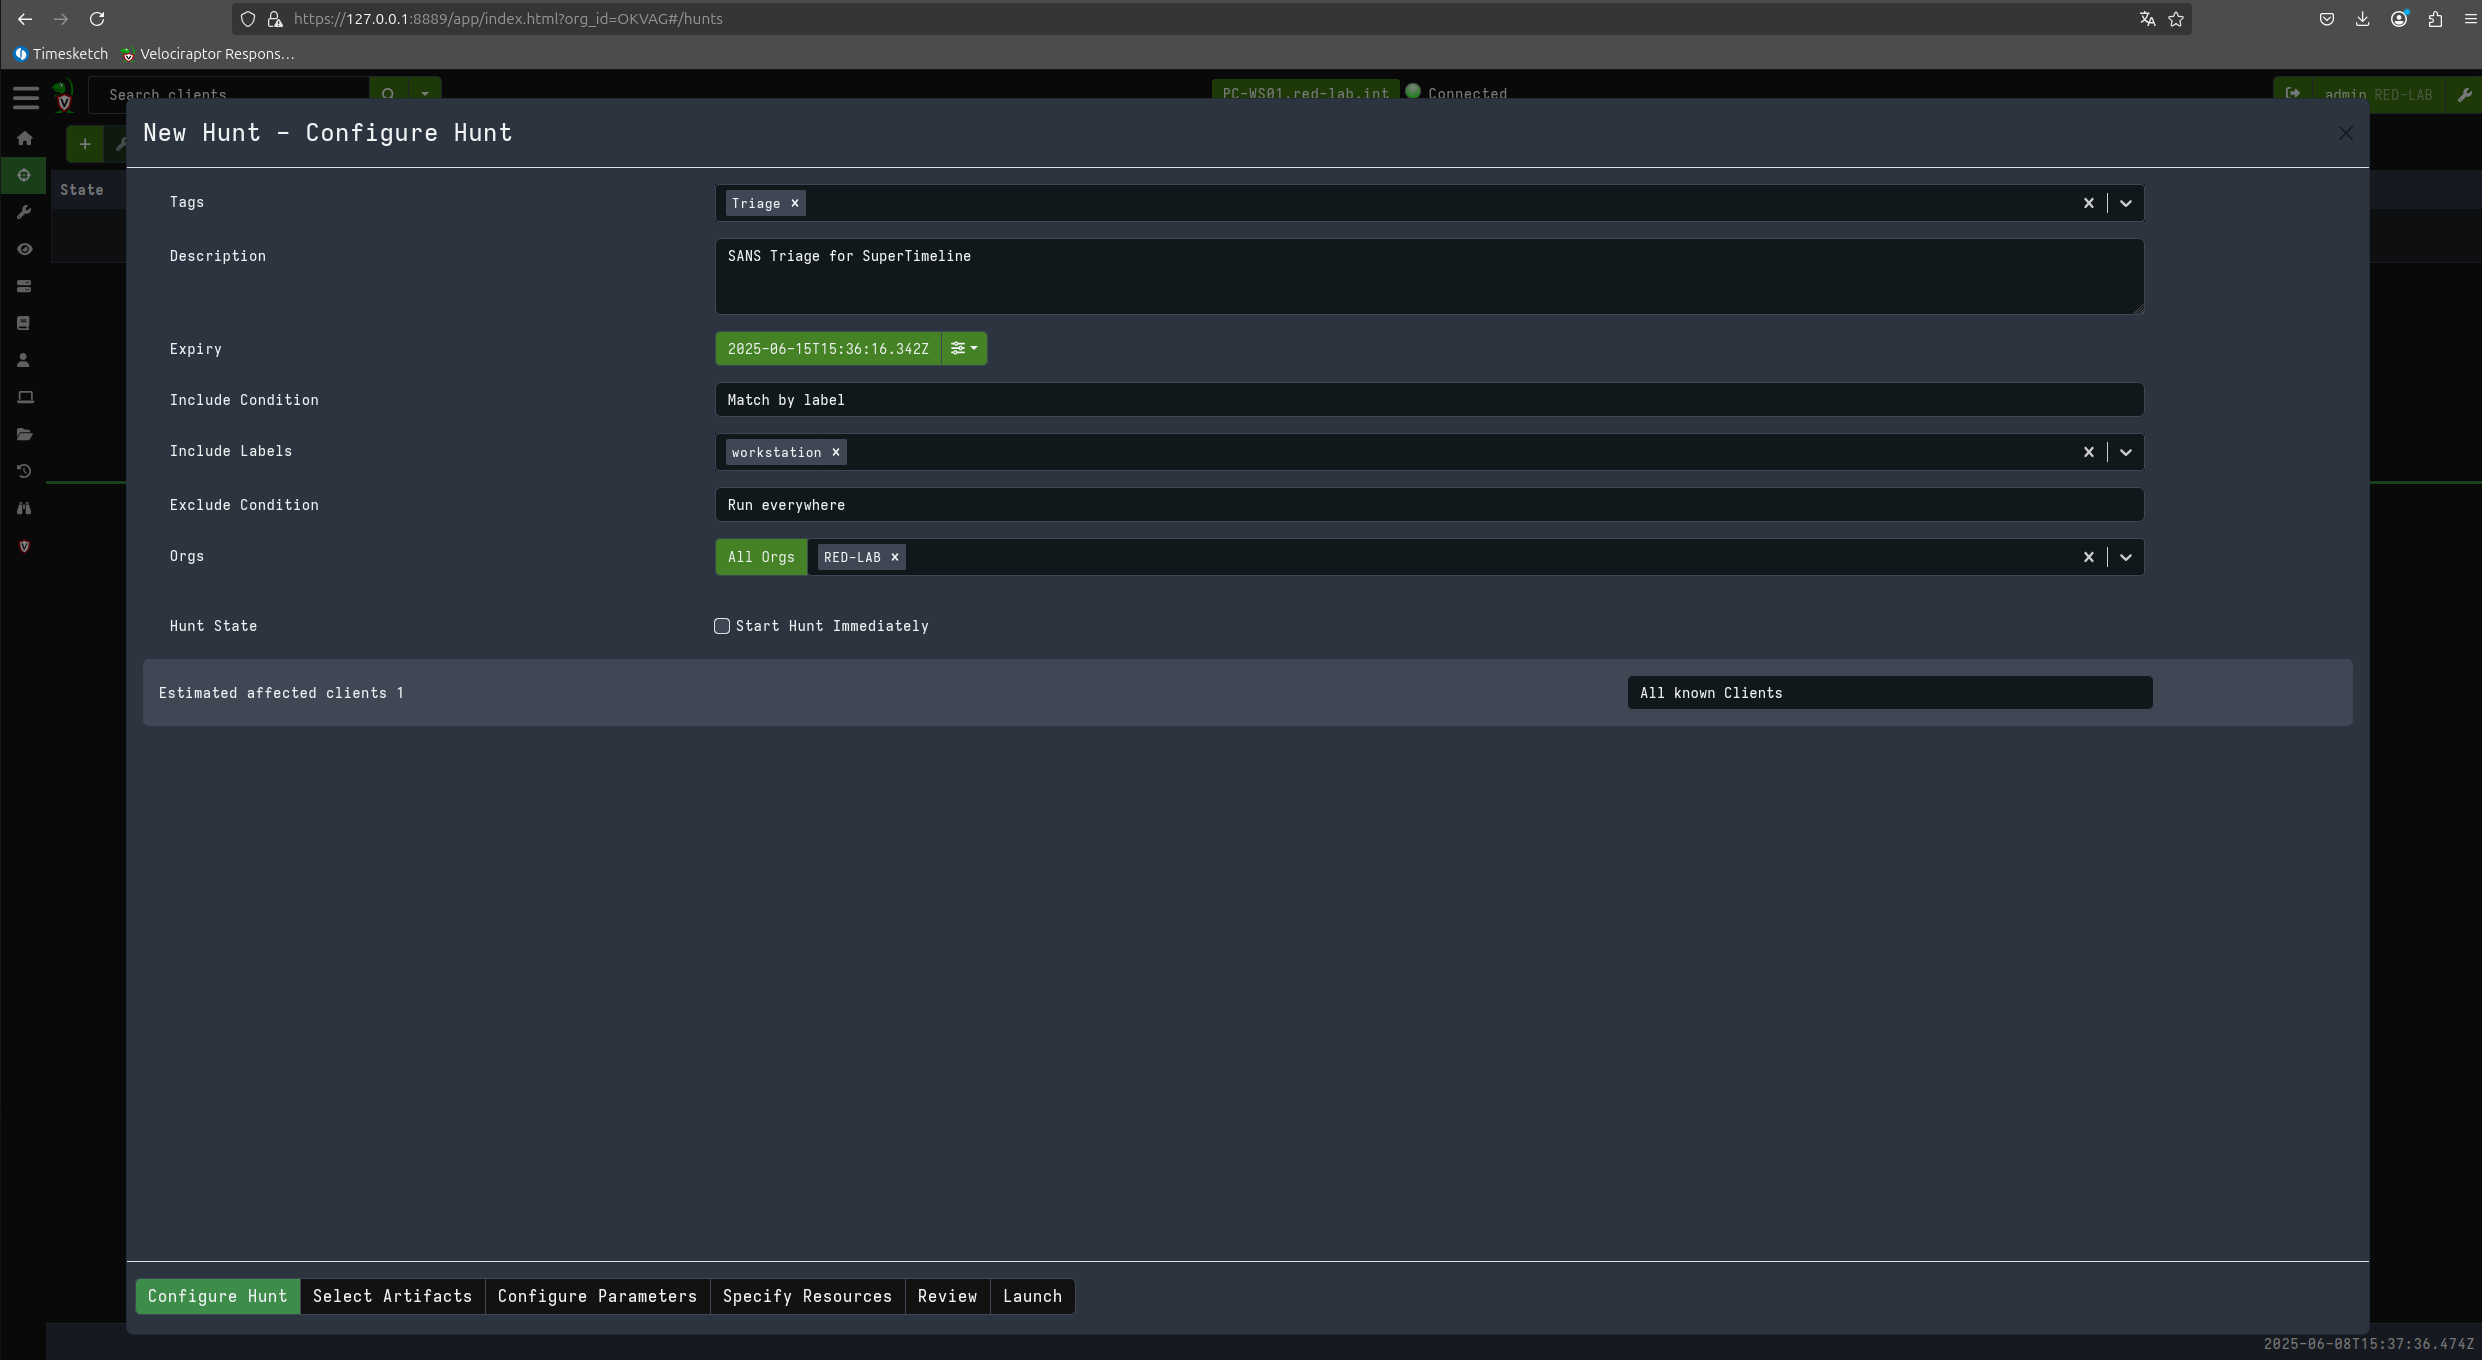
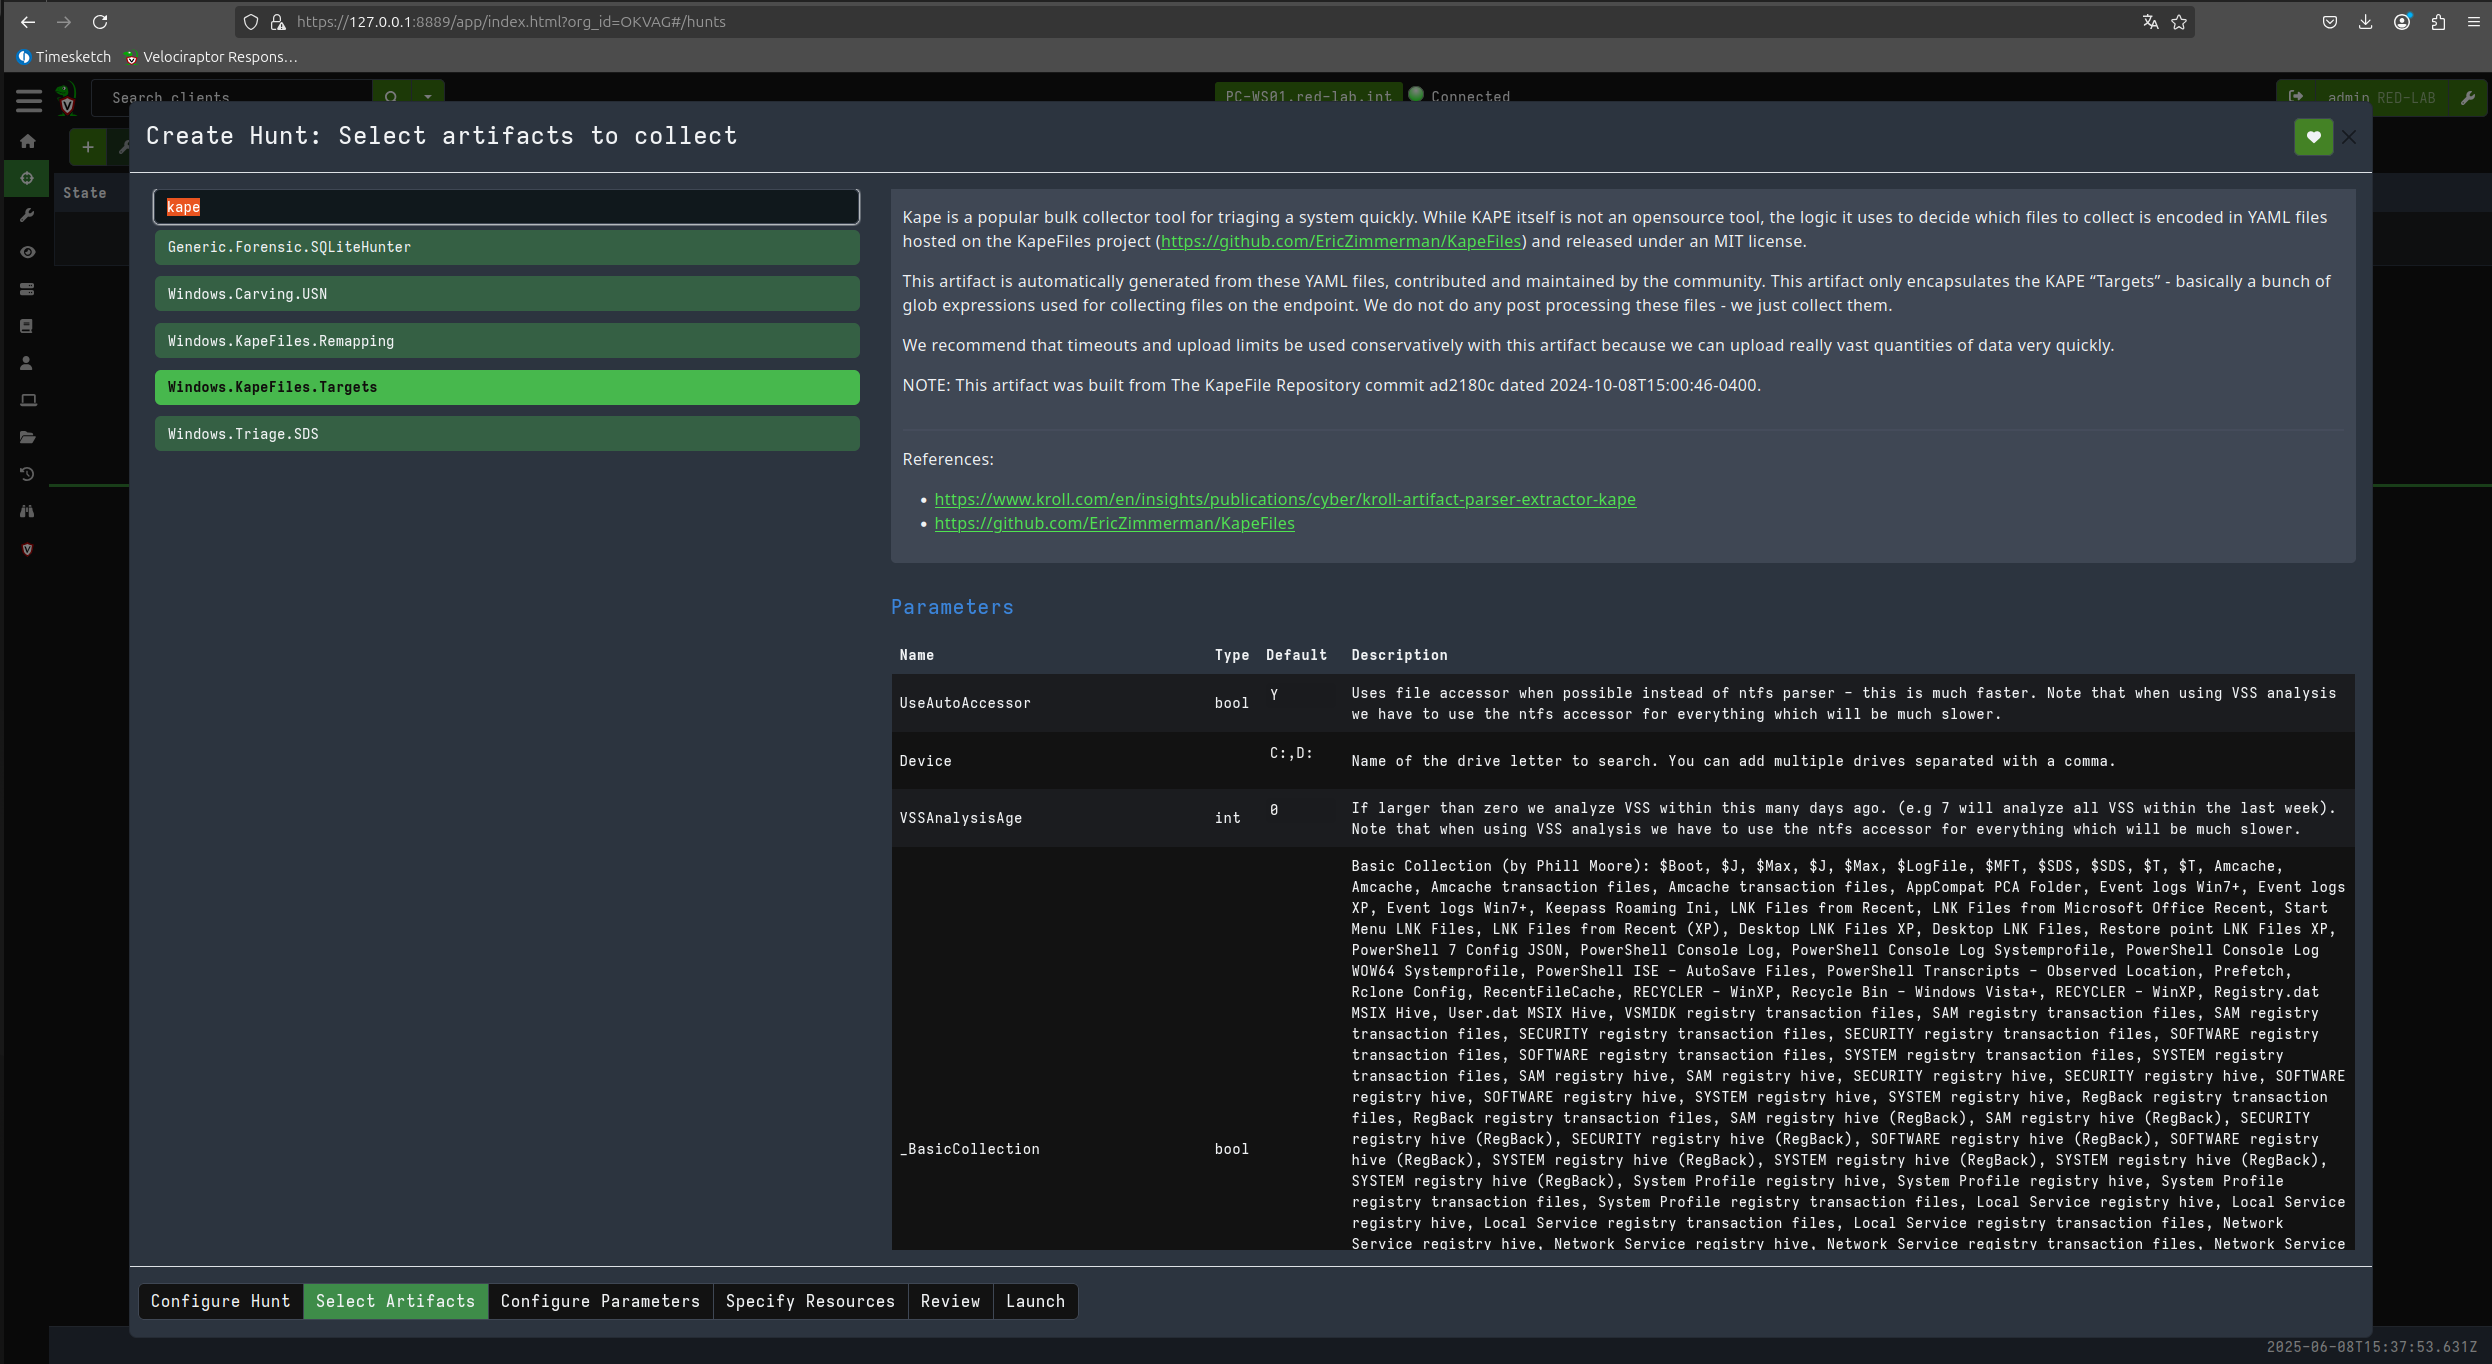
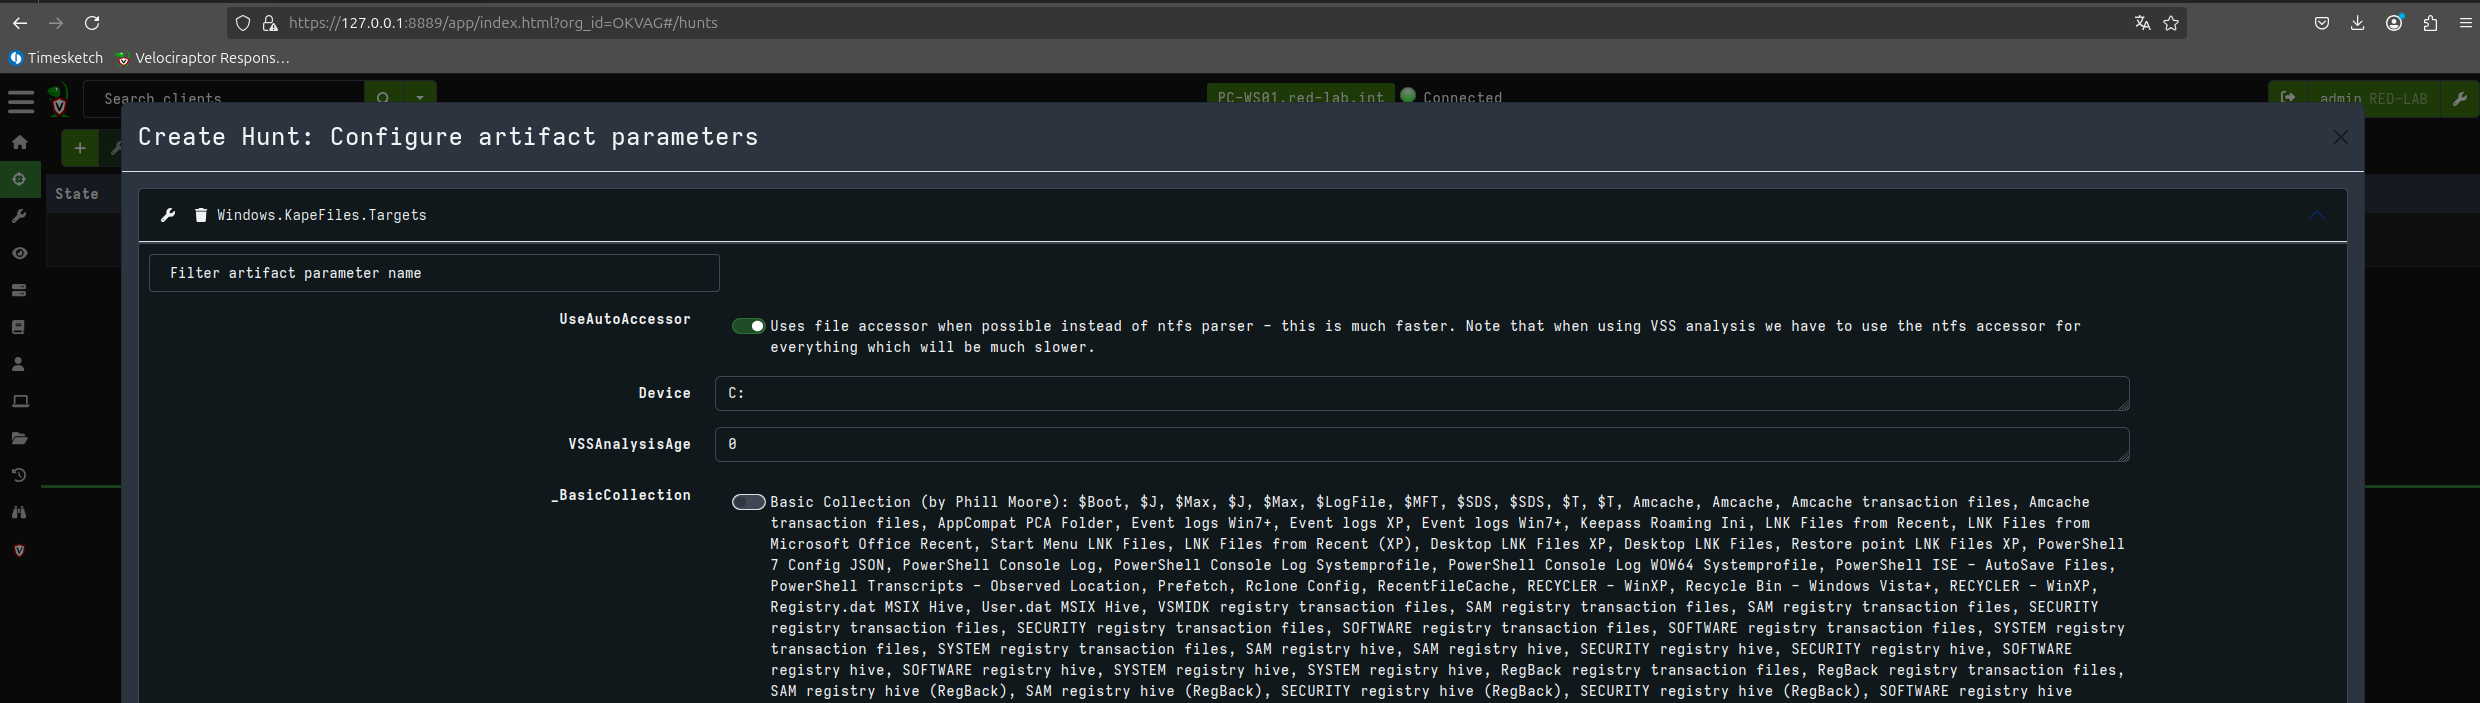
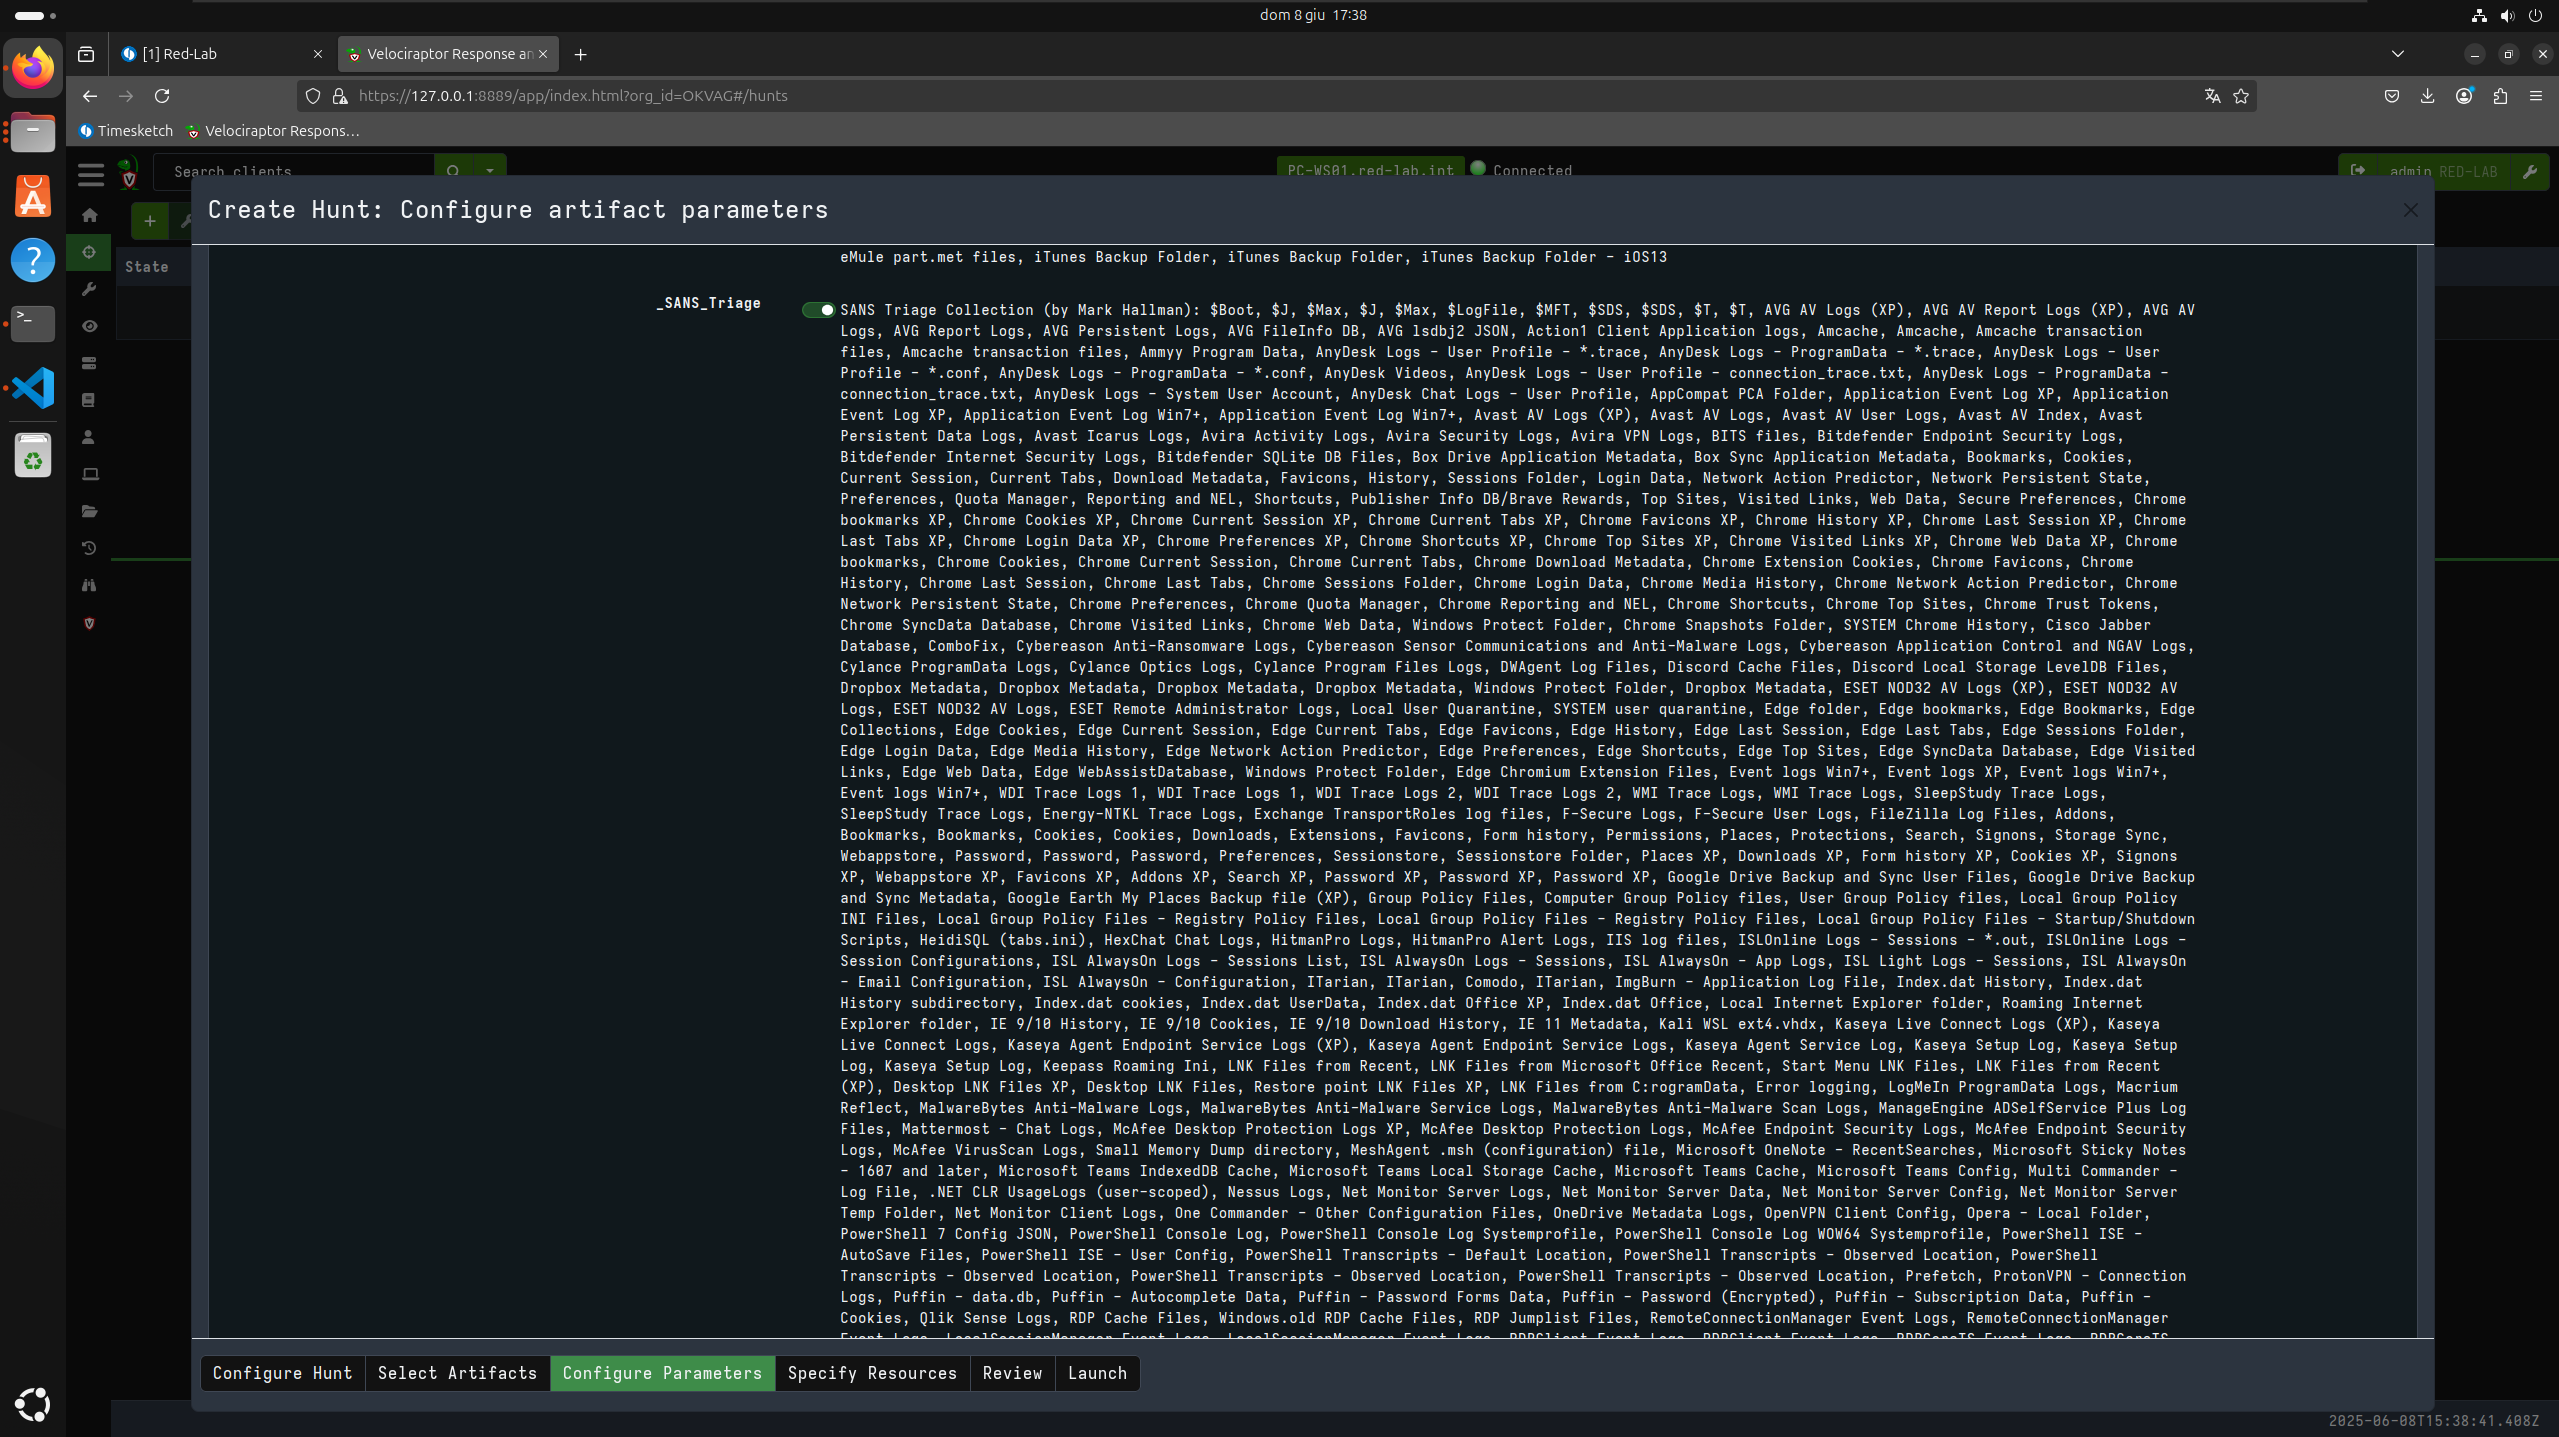
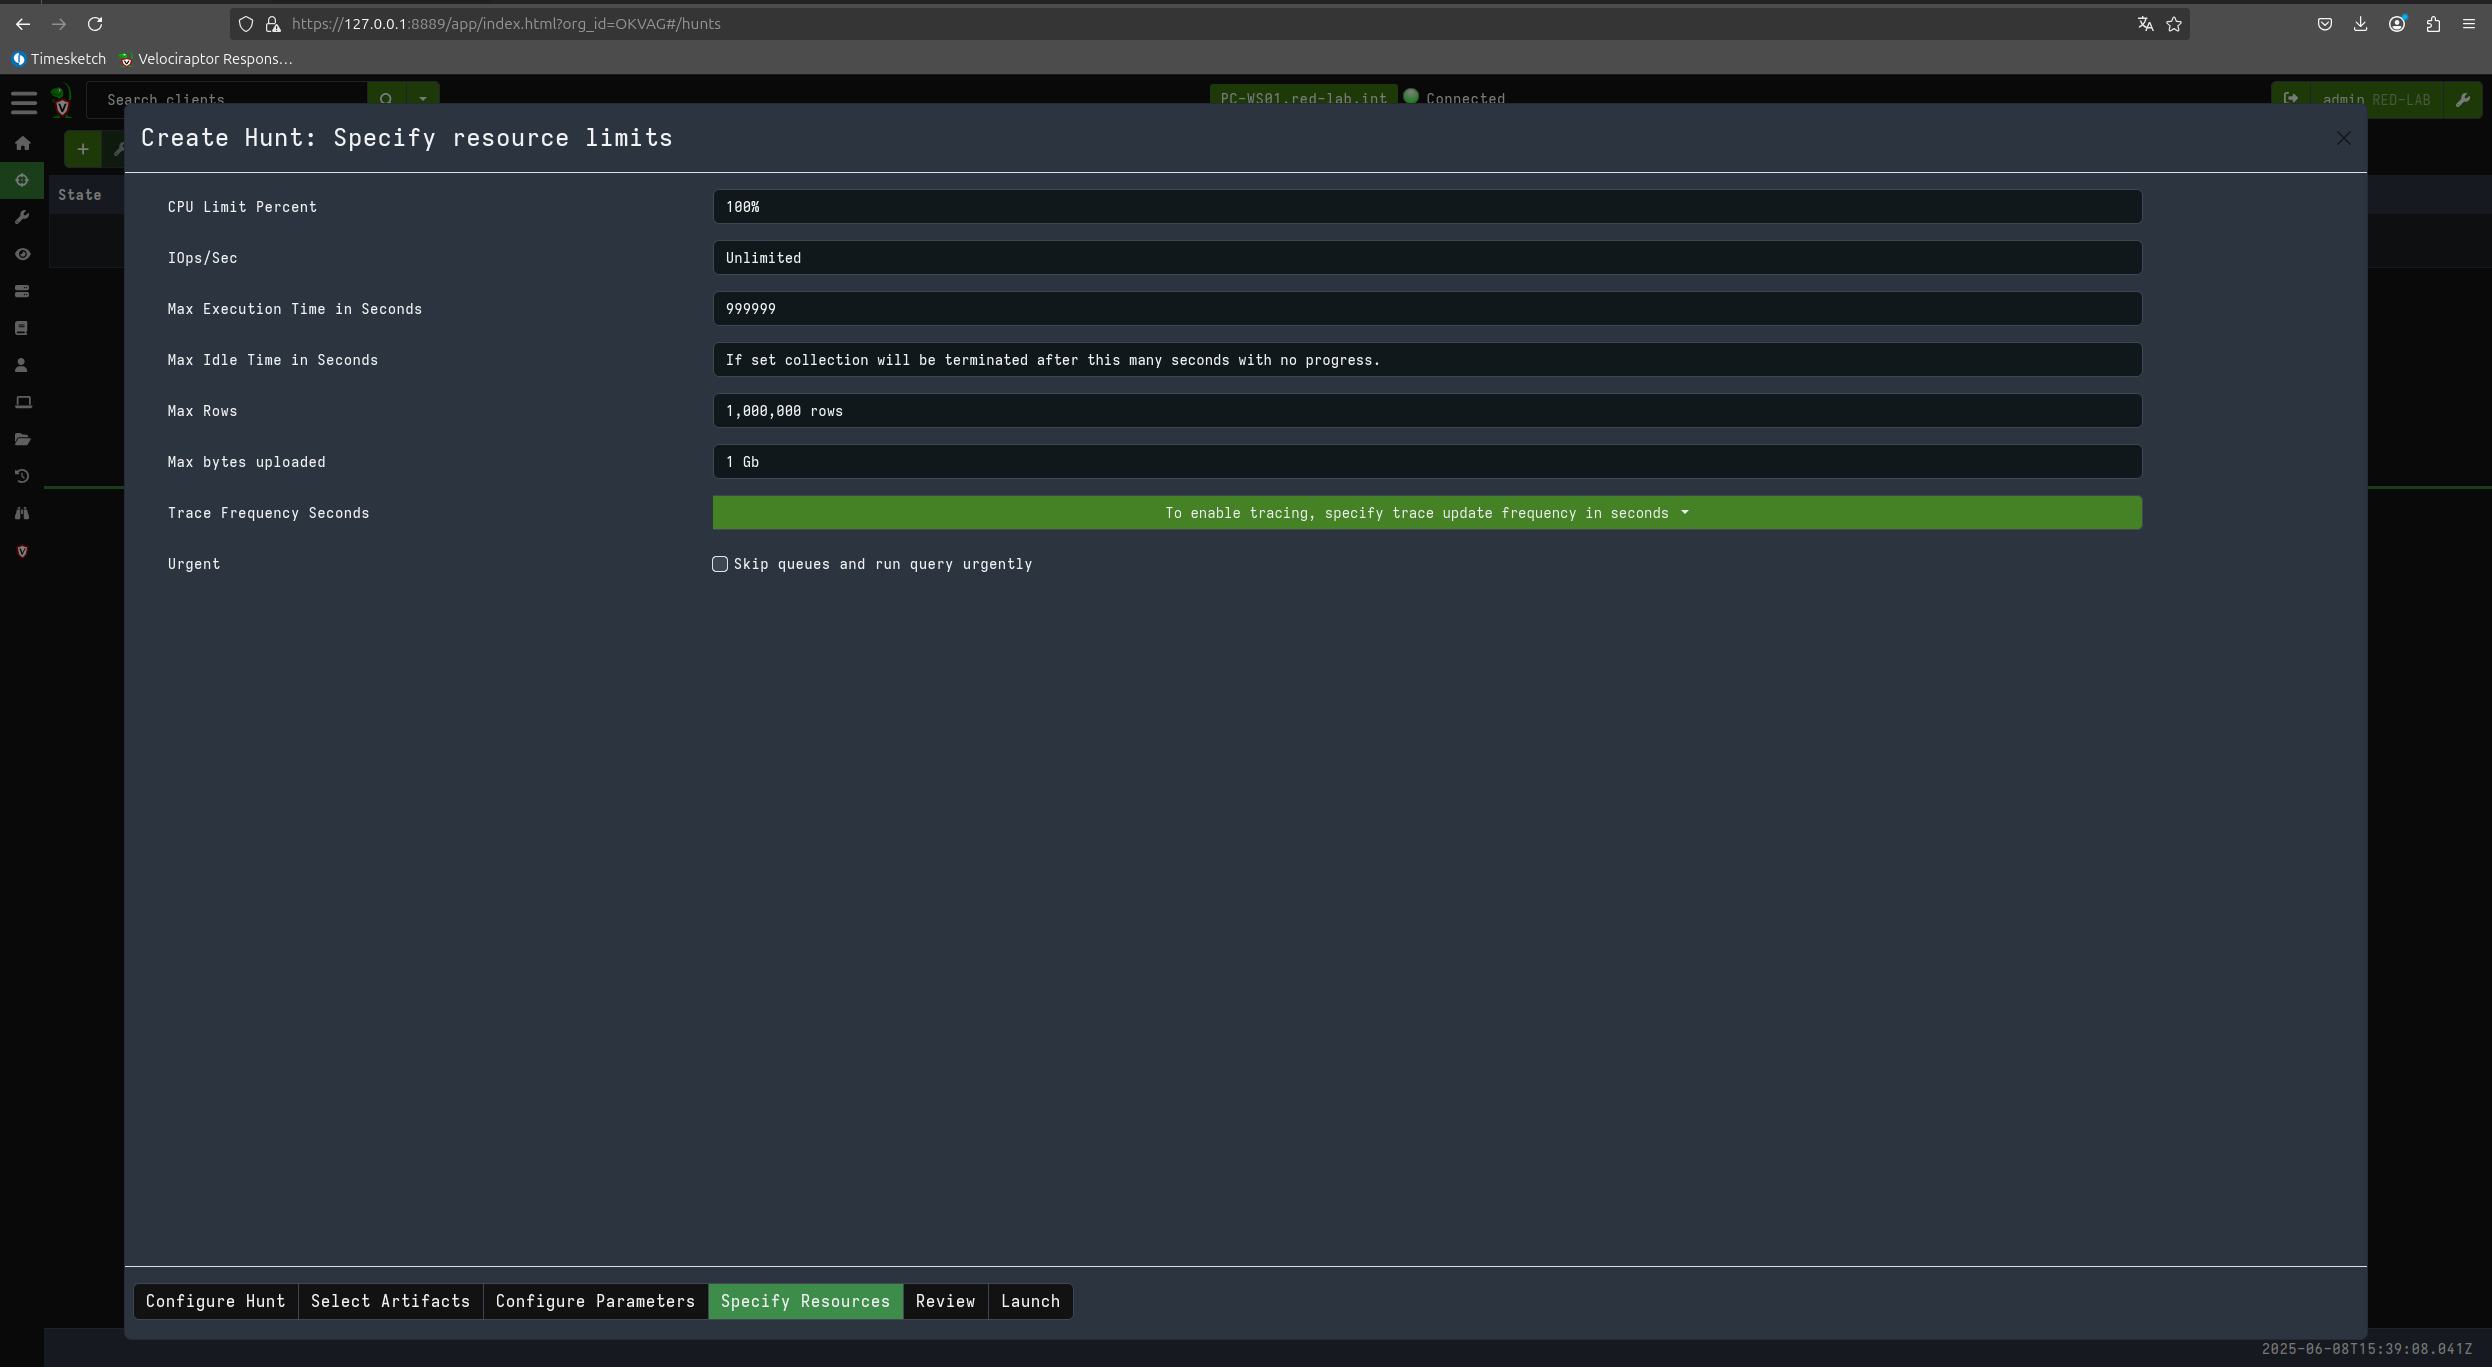
Now let’s proceed to perform a triage on the client in question using KAPE files and the SANS_Triage module.
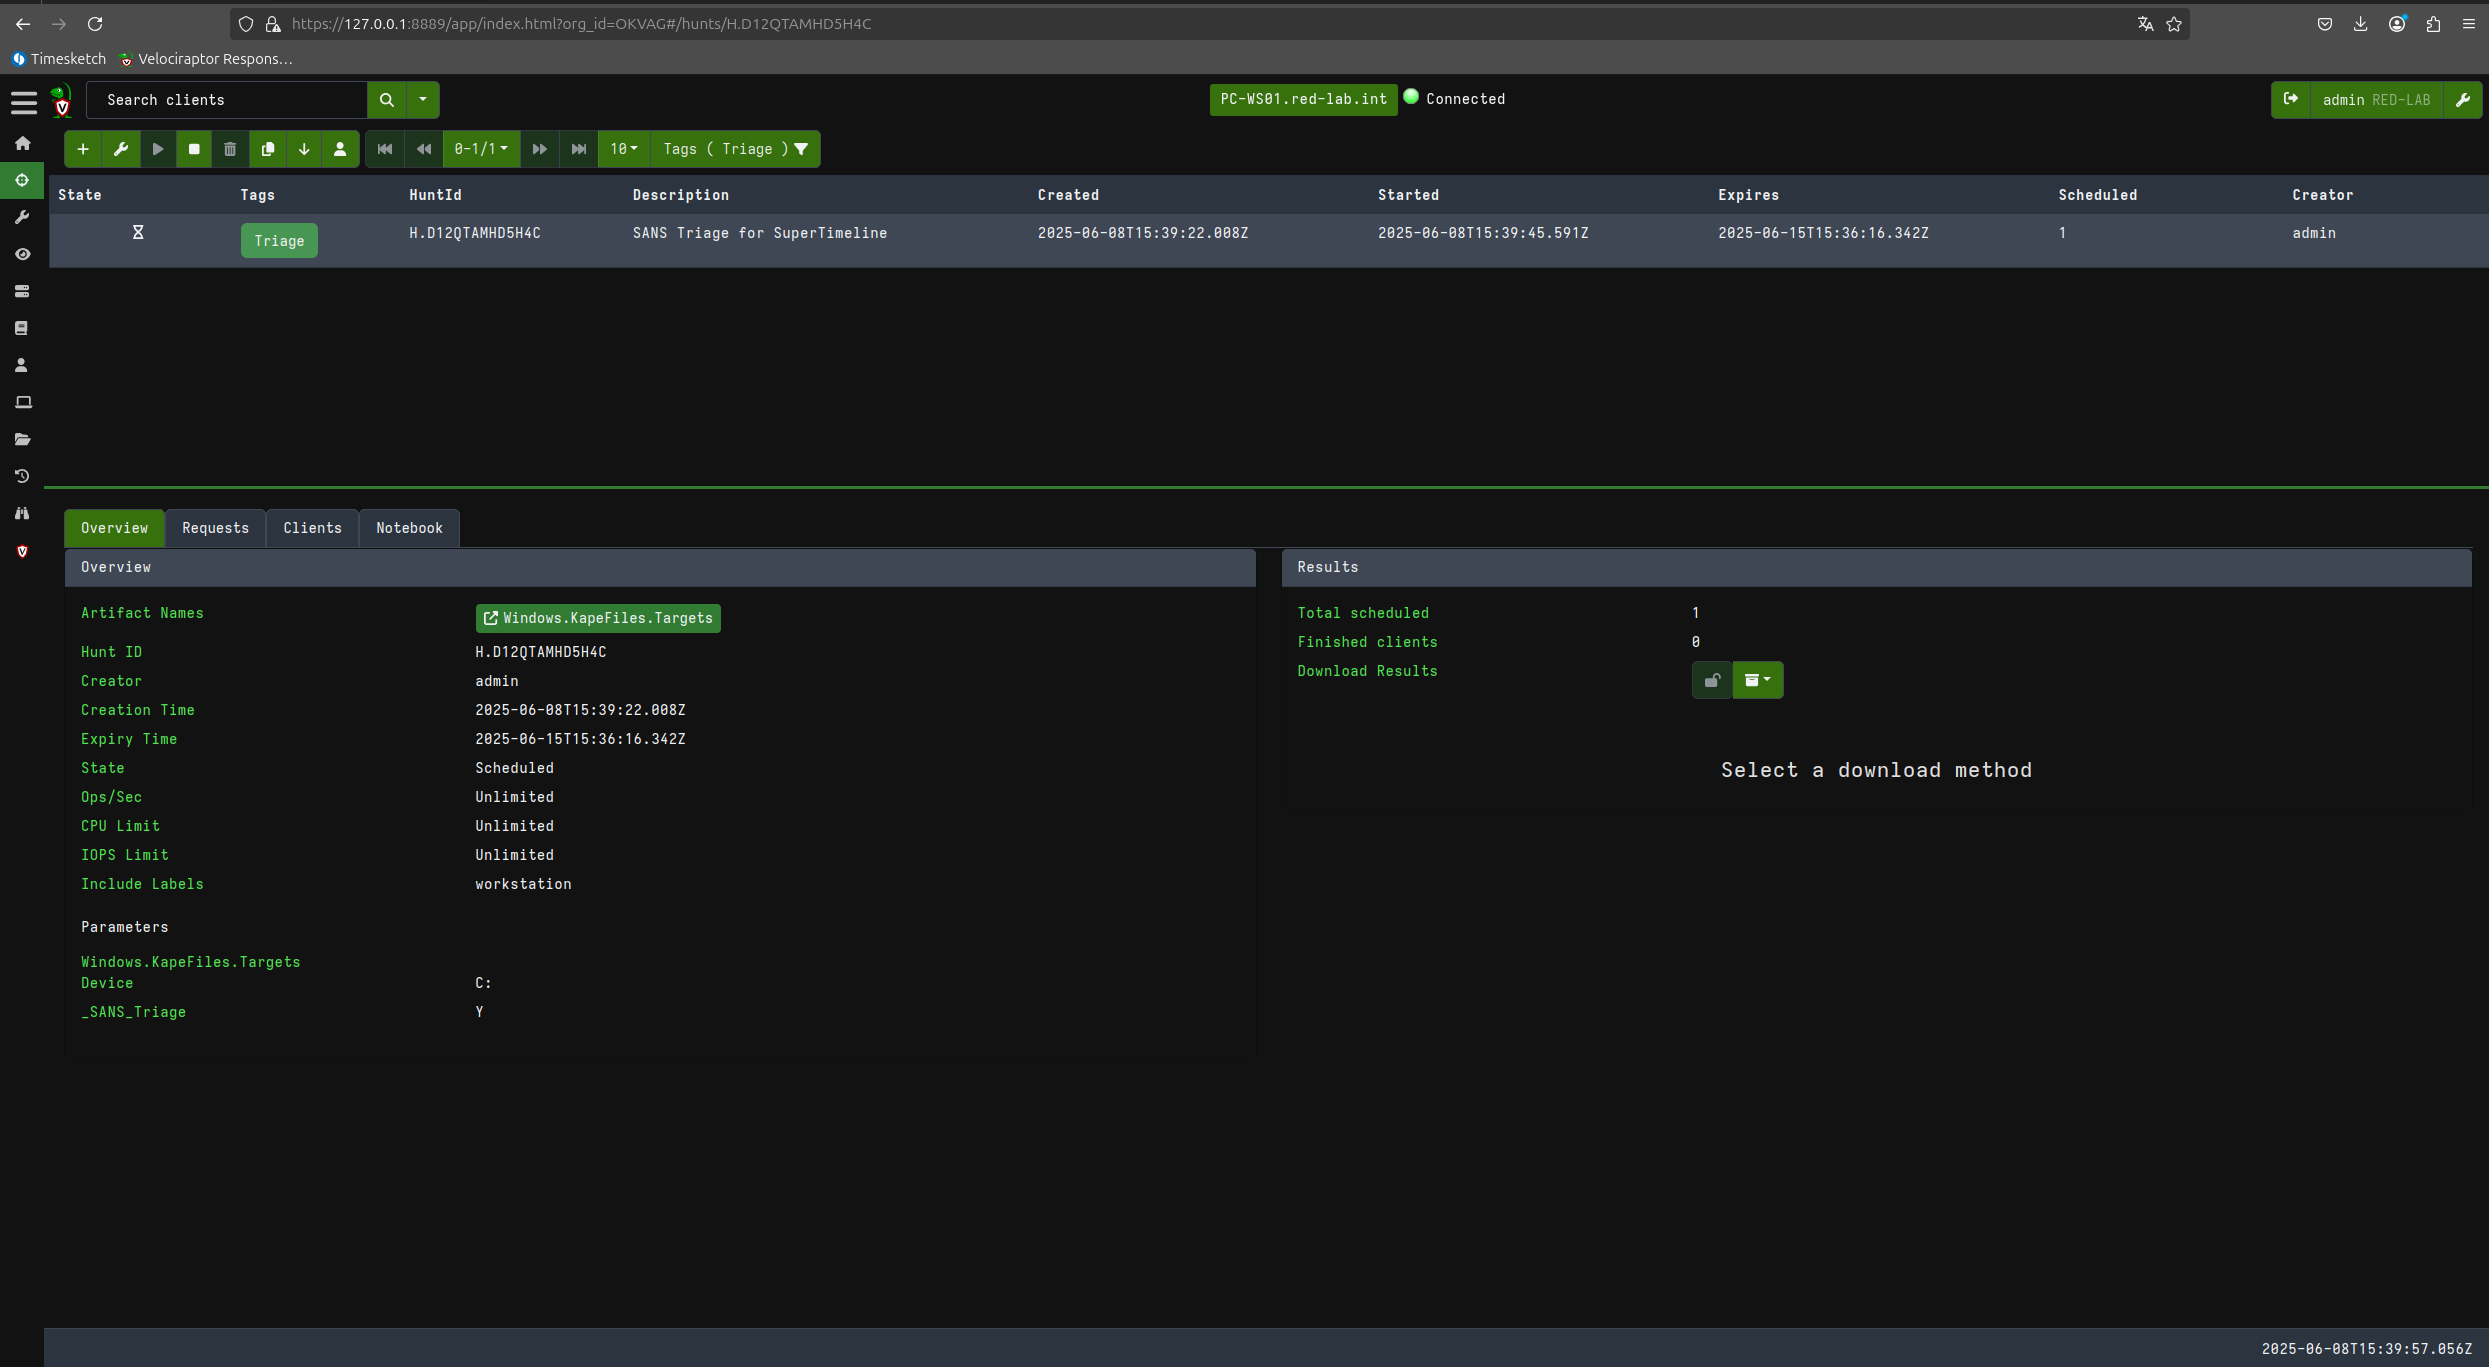

Now that I have downloaded the files acquired during triage, I can generate my super timeline with plaso using the same Timesketch container.
# unzip Haunt file
cd /tmp/
unzip -q /home/user/Scaricati/H.D12QTAMHD5H4C.zip -d WS01-Raw
mkdir /tmp/WS01
mv H.D124GB9SGJ12O/PC-WS01-C.c670b789871e759a-O8SE0/uploads/* /tmp/WS01

# move all the files into timesketch upload binded folder
sudo mv /tmp/WS01 /opt/timesketch/upload/
sudo
docker exec -i timesketch-worker /bin/bash -c "log2timeline.py --status_view window --storage-file /usr/share/timesketch/upload/WS01.plaso /usr/share/timesketch/upload/WS01/"
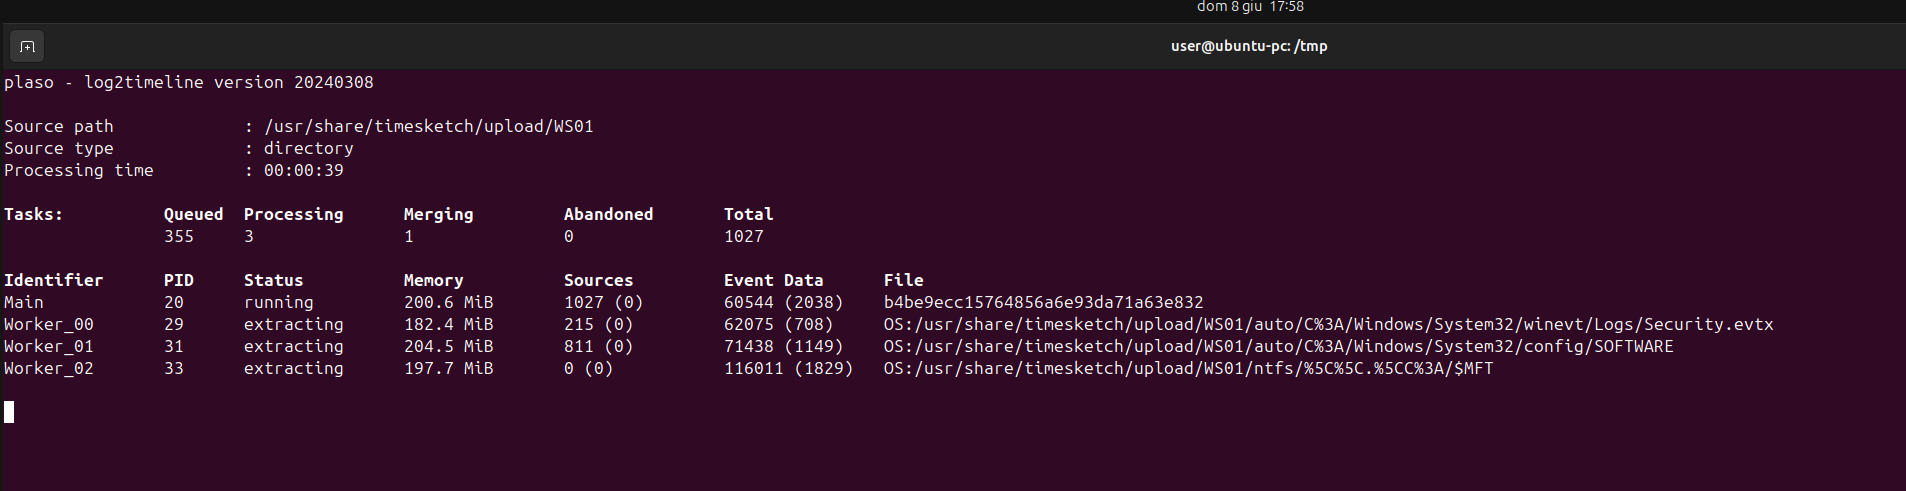
To process 1216MB across 1944 files, it took 10 minutes and 58 seconds.
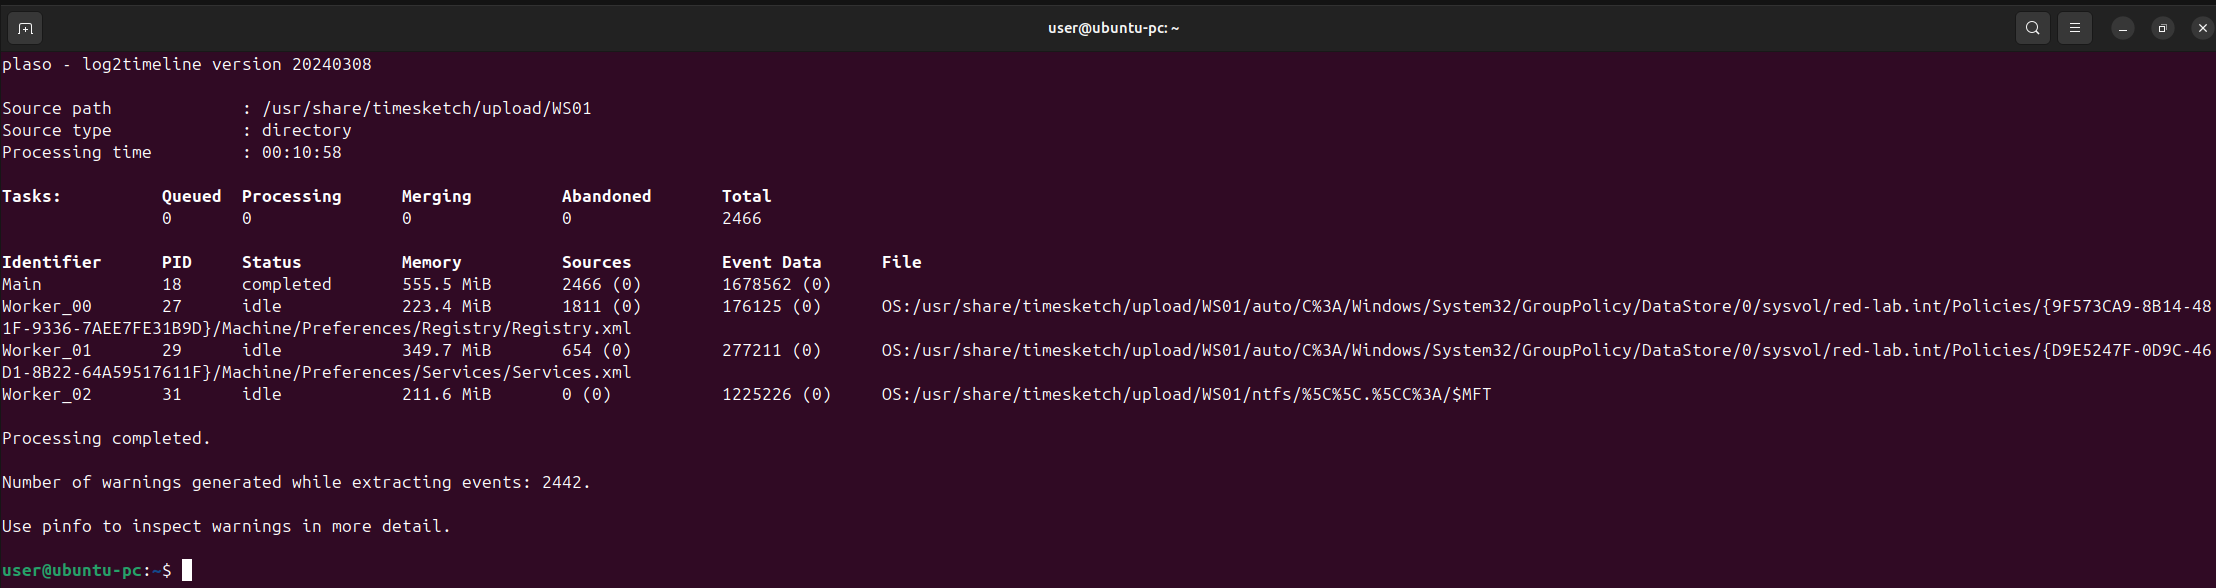
To analyze the warnings generated by plaso, you can use pinfo.py.
sudo docker exec -i timesketch-worker pinfo.py /usr/share/timesketch/upload/WS01.plaso
Now we can import the timeline in plaso format into Timesketch.
Let’s use the timesketch-web Docker container to list the available sketches.
# List sketches to GET Sketch ID
sudo docker exec -i timesketch-web tsctl list-sketches
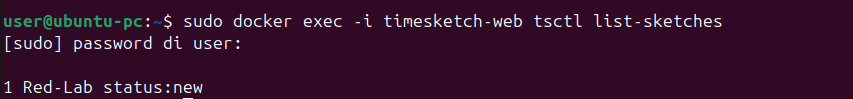
We can see our investigation named “Red-Lab” at number 1.
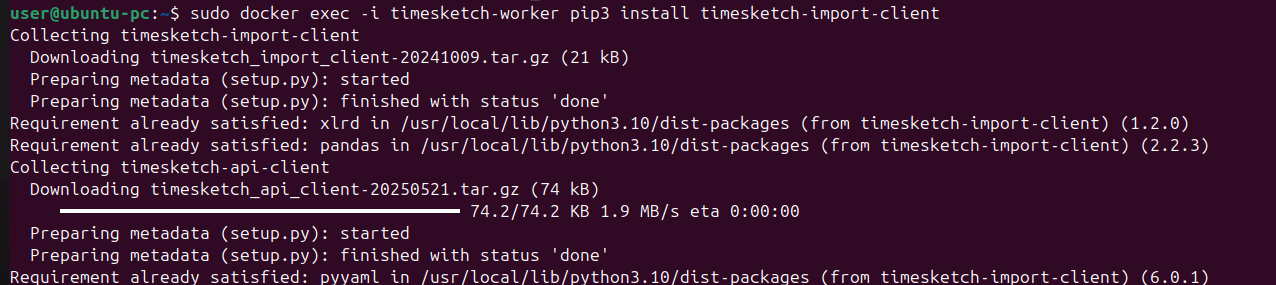
Now let’s import the .plaso file into Timesketch. To do this, we’ll use the -worker Docker container, which will run the importer and send data to the -web container using the credentials we created earlier—in our case, user:user.
However, you’ll notice that the importer is not installed in the -worker container by default. To resolve this, simply install it with pip3 inside the container. Of course, this operation can also be performed from a separate machine, but for convenience, we’ll keep all tools confined within their respective environments.
# Install timesketch-import-client into -worker container
sudo docker exec -i timesketch-worker pip3 install timesketch-import-client
Now we can import our super timeline into Timesketch.
# Import plaso file in timesketch
sudo docker exec -i timesketch-worker /bin/bash -c "timesketch_importer -u user -p 'user' --host http://timesketch-web:5000 --timeline_name WS01-Raptor --sketch_id 1 '/usr/share/timesketch/upload/WS01.plaso'"

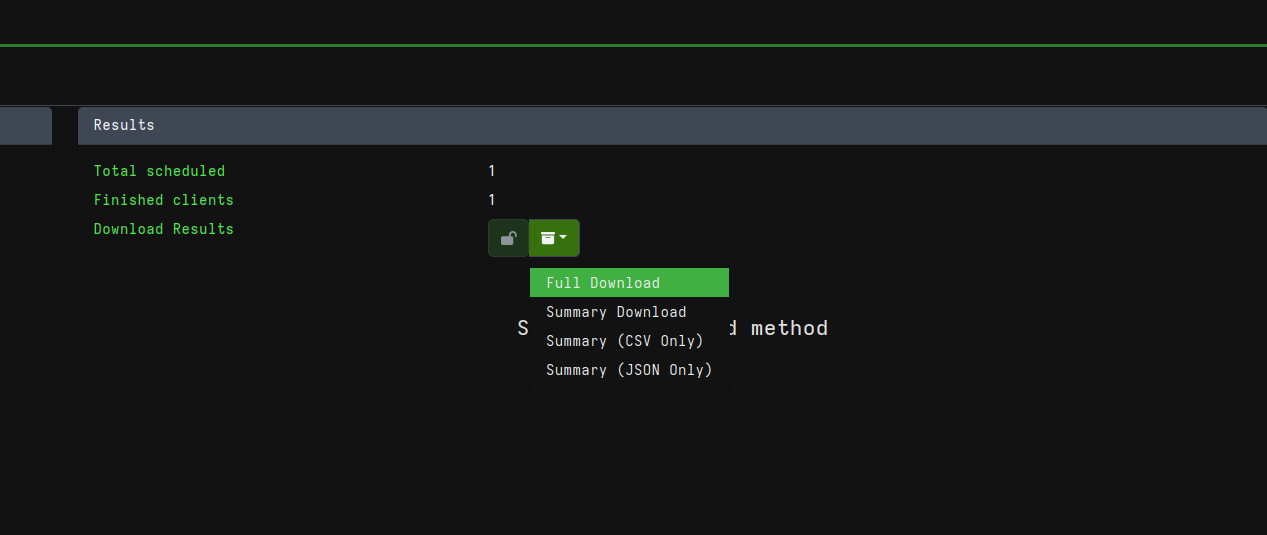
Once the upload has started, you can monitor the progress from the interface. It will take some time to complete the upload process.
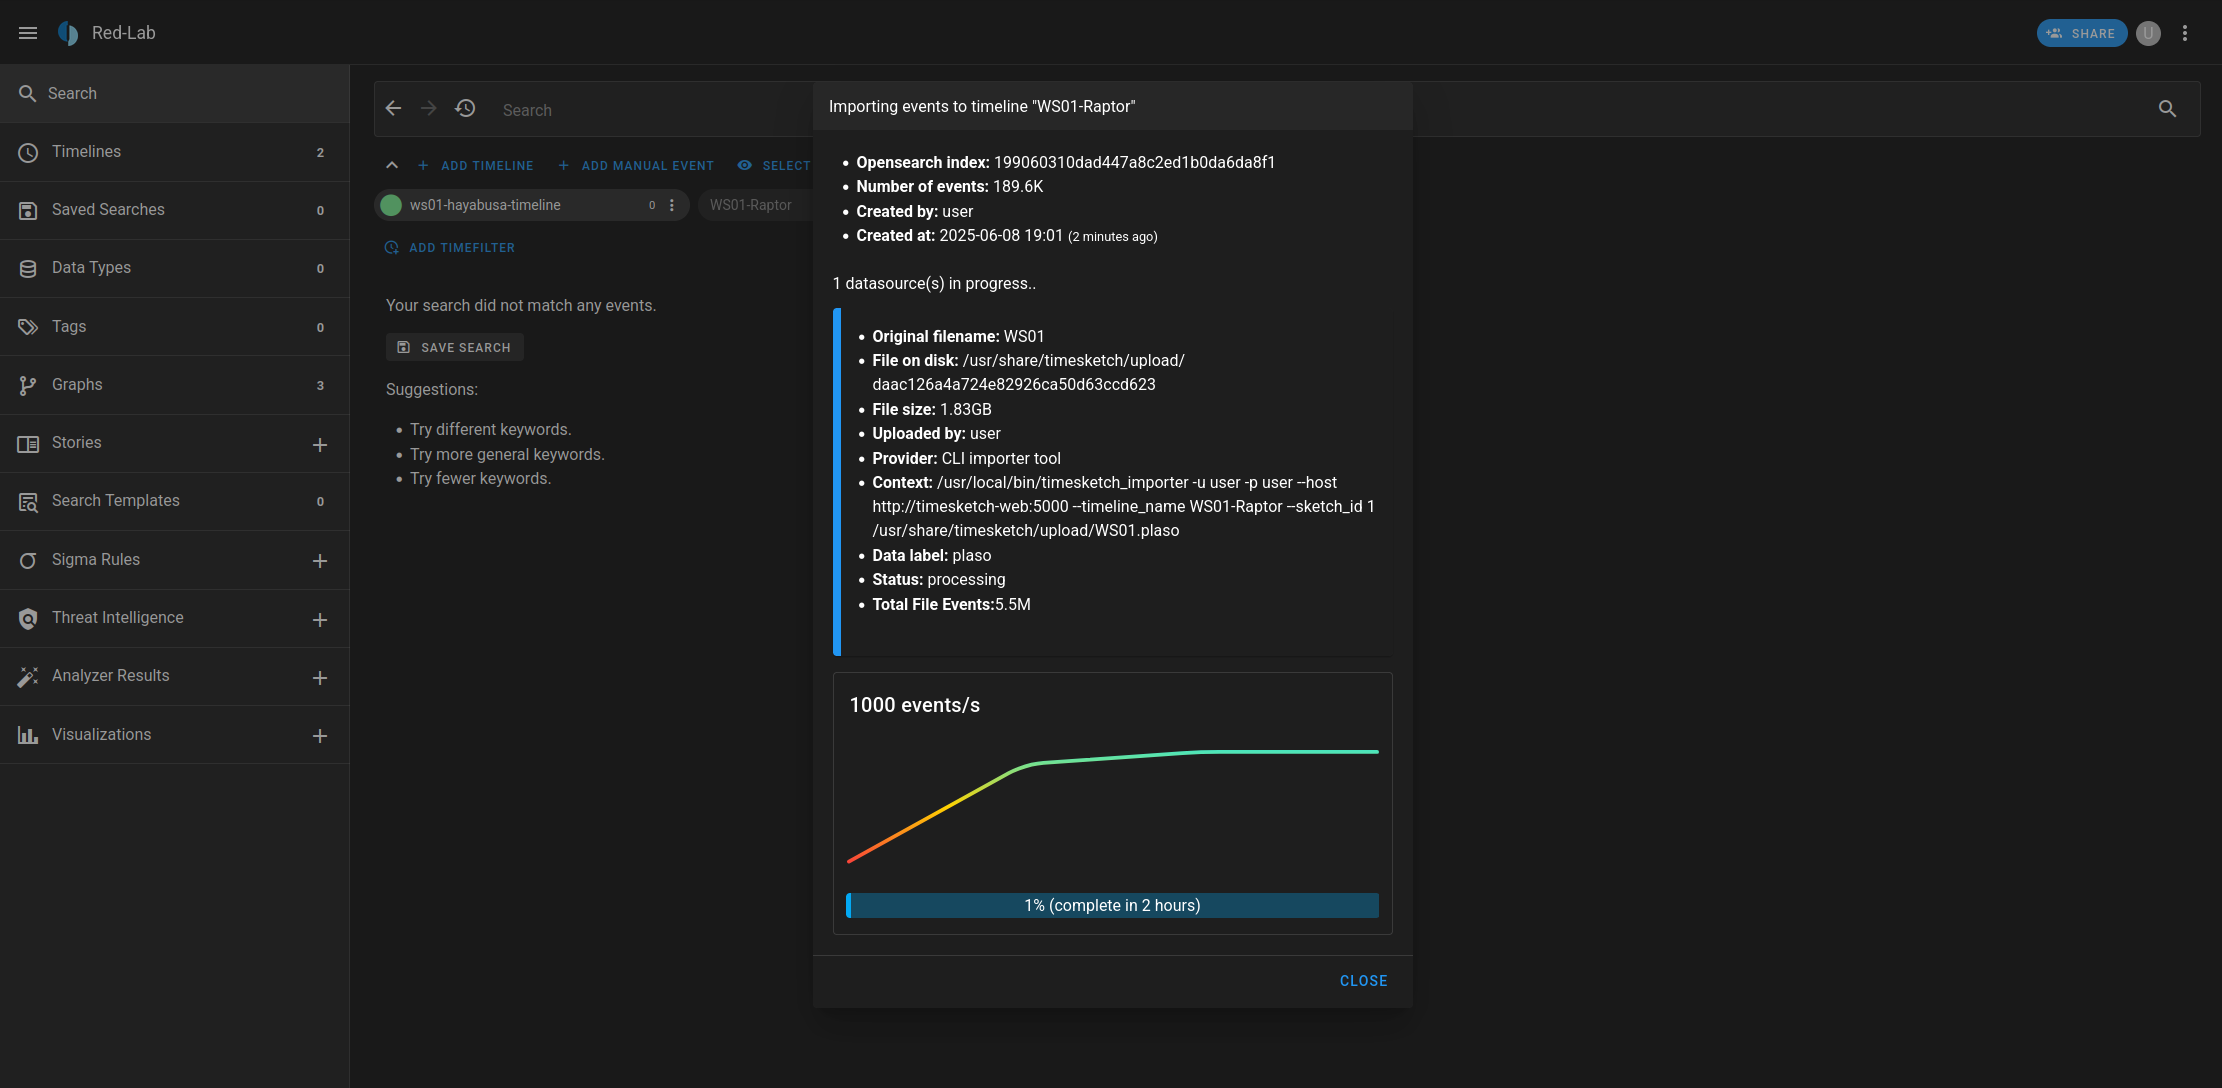
Here the import is in progress. With my setup, uploading 5.5 million events (1.83GB in size) takes about 2 hours.
Recap: Importing Velociraptor triage into Timesketch
Below is a summary of the commands to process the artifacts acquired via Velociraptor and import them into Timesketch:
# Extract the triage ZIP file into a working directory
cd /tmp/
unzip -q <PATH_TO_HAUNT_ZIP> -d WS01-Raw
mkdir /tmp/WS01
mv WS01-Raw/<SUBDIR>/uploads/* /tmp/WS01

# Move files into Timesketch bind-mounted folder
sudo mv /tmp/WS01 /opt/timesketch/upload/

# Generate the Plaso super timeline from the triage data
docker exec -i timesketch-worker /bin/bash -c \
"log2timeline.py --status_view window --storage-file /usr/share/timesketch/upload/WS01.plaso /usr/share/timesketch/upload/WS01/"

# List available sketches to retrieve the Sketch ID
docker exec -i timesketch-web tsctl list-sketches

# Install timesketch-import-client into timesketch-worker
sudo docker exec -i timesketch-worker pip3 install timesketch-import-client

# Import the Plaso file into Timesketch
docker exec -i timesketch-worker /bin/bash -c \
"timesketch_importer -u <USER> -p '<PASSWORD>' --host http://timesketch-web:5000 --timeline_name WS01-Raptor --sketch_id <SKETCH_ID> '/usr/share/timesketch/upload/WS01.plaso'"
This process:
- Extracts
Velociraptortriage artifacts - Generates a
Plasotimeline - Imports the timeline into
Timesketchfor interactive investigation.
Conclusions
The two approaches explored, manual acquisition with Hayabusa and automated triage with Velociraptor, demonstrate two complementary methodologies for creating a super-timeline and analyzing it within Timesketch.
With Hayabusa, the process is quick and direct: logs are parsed locally, transformed into a timeline (CSV), and immediately imported into Timesketch. This method requires physical or remote access to the host and is ideal for single-host, fast-response scenarios or when dealing with a known, limited data set.
It is worth noting that Hayabusa can also be executed through Velociraptor as part of a larger workflow. The key difference is that Hayabusa generates a timeline using Sigma-based detection rules, focusing on event interpretation at the log level.
In contrast, Velociraptor integrates endpoint collection, orchestration, and automation into a scalable solution. The client-server architecture allows large environments to be covered, using KAPE/SANS_Triage artifacts as a data source. The integration with plaso introduces a crucial advantage: the ability to generate a high-fidelity super-timeline covering thousands of files, which can then be imported into Timesketch for deep, collaborative investigations.
This second method requires greater setup and operational maturity, but it offers repeatability, automation, and scalability, which are fundamental in enterprise or SOC/CSIRT contexts. Furthermore, the entire Velociraptor → plaso → Timesketch workflow can also be fully automated, from artifact acquisition to timeline generation and import.
The Timesketch platform emerges as the focal point for analysis, correlation, and visualization, regardless of how data is acquired. Its collaborative model allows analysts to correlate different sources of evidence, enrich them with annotations, and pivot across events with speed and precision.
In summary:
Hayabusa: fast, lightweight, excellent for live-response or isolated hosts; Sigma rules provide ready-made detection logic and timeline enrichment.Velociraptor+plaso: structured, scalable, suited to enterprise environments and systematic digital forensics, with potential for full automation.Timesketch: a centralized, collaborative analysis hub.
Together, these tools transform raw forensic data into structured, searchable timelines, drastically reducing the time from evidence acquisition to incident reconstruction.
In modern DFIR workflows, the combination of automated triage, structured timelines, and visual analysis is no longer optional but an essential capability to respond quickly and accurately to complex threats.